Release Notes
February 2023
Long time no see and welcome to the February 2023 Update of PAFnow. With the February Update we mainly focused on our PAFnow Companion with some UX/UI changes, new features and an API update.
PAFnow Companion 1.7
We have redesigned the entire multi-report view and added two new features. In addition to the update action, you can now also import or remove all visuals from all selected reports with one click. Check it out!

References:
April 2022
In April 2022, the PAFnow Companion was revised in terms of user interface and user experience.
PAFnow Companion 1.6
We have implemented a new drag-and-drop area - the whole page can be used to drag and drop reports or CSV files, depending on what task you need.
The Report Activation tab has been removed in favor of using the functionality in the Report Management. Now you can find everything in one place.
Furthermore, it is now possible to drag multiple reports to the Report Management or even a folder and apply multiple actions to them, such as activating the reports by setting a license key or updating PAFnow Custom Visuals as a whole.
We also simplified the table of recent reports in Report Management and added a search function.
The report view has also been cleaned up and simplified
References:
December 2021
With the December 2021 update the PAFnow Process Explorer got two cool new features, with which it is even more fun to work with the process graph.
PAFnow Process Explorer 2021.12.0
Both features can be activated via the Settings Pane. There you can find both the animation and the interactivity. When you switch on the animation, you will be able to see how the processes are built up in your process graph.This gives you a smooth transition when your process graph is created.
Also try out the interactivity and be able to adapt the entire layout of your process graph to your needs. Would you like your happy path to run vertically and all deviations to be shown on the sides? No problem! You can move the edges as well as the nodes and the start and end points as you wish. Select an edge and use your mouse to move it to your desired location. There are no limits to the layout of your process graph anymore.

You can use the layout restore button  to delete your adjustments.
October 2021
Welcome to the October 2021 Update of PAFnow. With the October Update we mainly focused on our PAFnow Event Filter for the Compliance Analysis and the PAFnow Companion for transformation and update management.
PAFnow Event Filter 2021.10
The PAFnow Event Filter received a complete makeover with the new version. In addition to the previous functionality, that was further simplified, there are a lot of new features and layout options. In this way you can customize the PAFnow Event Filter according to your needs.
What’s new? For an easier compilation of the process sequences for your Compliance Analysis, we added a preview when dragging an event from the activity list on the right over a node in the graph. Now you can easily select if you want the event to be linked with a parallel (AND) or exclusive (OR) gateway. Complementary, the new tooltips show the current state of the relations (directly/eventually followed) and exclusive and parallel gateways, too. An explanation how to build and use the PAFnow Event Filter you can find here.

We also added a toggle button for the activity list to collapse for better visibility, e.g., when the PAFnow Event Filter has little space on your report page. The activity list opens automatically, when the focus mode is active. The activity list is also resizable now.
In the formatting options you can also adjust the theme colors, the direction of the graph ( Top-Bottom, Left-Right etc.) or select the fit layout for better visibility. You can also activate animation and the minimap for better navigation.
PAFnow Companion 1.5
The PAFnow Companion got a performance enhancement and a complete redesign. We changed colors, fonts, hover effects for buttons and redesigned the light and dark design theme.
Do you already think it's great that you can update all PAFnow Custom Visuals in one report for all your users? With the new drag-and-drop-area you can also easily upload more files. Thus you have the possibility to update all PAFnow Custom Visuals in all reports at once. Click the Report Management tab and choose Update All. Now all visuals in all your reports will be updated to the latest version.
In order to find certain, frequently used reports faster, we have also improved the organization of the reports. You now have the option to pin reports so that they are always at the top and at hand in your report management overview. You can find the most recently used reports under the Recent tab.

Try it out and download the newest versions on your PAFnow Download Page.
August 2021
This update is mainly about version management features in the new PAFnow Companion version 1.4 and for the well-known PAFnow Download Page. The PAFnow Companion now allows you to update, download and manage PAFnow Visuals and PAFnow Reports. With these new features it is also possible to download older versions and pre-release versions as they become available for the Download Page and the PAFnow Companion in version 1.4.0 or later.
Get access to the beta version
Contact us if you want to get beta access and test our pre-release versions. We can all benefit, you by getting early access to new features, and us by evolving our products and getting a better product through your feedback - a win-win situation.*
* Be aware that the current version may be drastically changed and no longer compatible with the beta version. Therefore, the pre-release versions should not be used in production environments.
PAFnow Companion 1.4
The new PAFnow Companion got a redesign - there are two new pages Report Managment and Download available through the corresponding tab and icon in the menu. Download can also be accessed by the windows notification of available new versions of PAFnow Visuals.

The documentation for each can be found: * For the Report Management here. * For the Download page can be found here.
PAFnow Lead Time Calculator 2021.8
The new version of the PAFnow Lead Time Calculator calculates lead times more efficiently using a better sampling algorithm.
June 2021
All visuals got an icon makeover to represent their corresponding visuals more precise.
| Process Explorer | Duration Card | ||
| Histogram Slicer | Pareto | ||
| Case Viewer | Root Cause Analyzer | ||
| Event Filter | Lead Time Calculator | ||
| Attribute Filter | Document Flow |
Process Explorer, Lead Time Calculator, Duration Card, Case Viewer
We added more units for the calculation of the durations to be able to show a duration in milliseconds, microseconds and nanoseconds.
Pareto
We added the functionality to select and filter outside visuals with the parts of the pareto visual. The Pareto Visual now also responds to filters from other visuals.
Companion
We added the functionality to export a BPMN model from the Process Explorer, therefore you need the latest Process Explorer and the Companion 1.3.0 or later.
May 2021
The May 2021 Update includes internal optimizations of each PAFnow Visual and an updated authentication method. This update introduces license keys usable to share your reports with Concurrent Viewers. These do not have to install the PAFnow Companion see.
PAFnow Companion 1.2.5
A new tab is available for a named editor to unlock reports for the PAFnow Visuals with a created license key (see).

PAFnow Visuals 2021.5
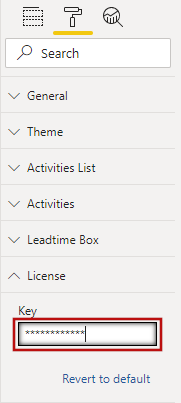
The license key can also be added via the visual settings to read more look here.
Lead Time Calculater
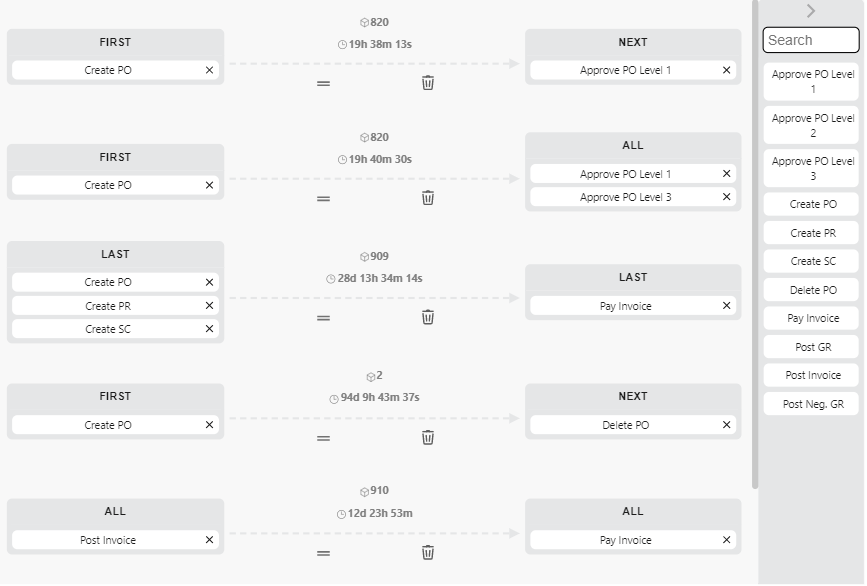
After feedback from customer and brainstorming we come up with a new calculation method for the Lead Time Calculator. Introducing First, Next, Last and All as new measeauring points (see)
April 2021
Welcome to the April 2021 release of PAFnow. The updates in this version include:
The PAFnow Companion and all PAFnow Custom Visuals received an update.
PAFnow Companion 1.2.0
The authentication method has been redesigned. The PAFnow Companion now uses the Open Authentication method. The new authentication method is supported by all visuals starting with the PAFnow Custom Visuals of version 2021.4. The PAFnow Companion now registers the native theme setting of Windows and can set the theme to Dark Mode depending on the native setting.
This version also fixes some previous issues, such as offline transformation, error messages and allows the installation on silent mode without prompt.
PAFnow Custom Visuals
With version 2021.4 all PAFnow Custom Visuals allow the new authentication and authorization method.
Attention
The PAFnow Visuals version 2021.4 or later only work with a PAFnow Companion version 1.2.0 or later.
PAFnow Lead Time Calculator
The new redesigned PAFnow Lead Time Calculator offers a cleaner and more efficient way to visualize the lead times between two or more process activities. With the new drag-and-drop behavior you can easily setup and view your lead times with few clicks. For more information refer to here.
March 2021
SSIS Package
Logging to a Table
To improve the way SSIS handles logging, going forward, the logs will no longer be written to file!
From now on, logs will be stored in a table on a SQL database of your choice. There will be a new connection manager called LogSqlConnection in the SSIS configuration interface to reference this database.
The most important error messages will even be shown in the Messages section of SSMS's Integration Services Dashboard report! Please add the specific error message to any support request you might have for our PAFnow-Support team.
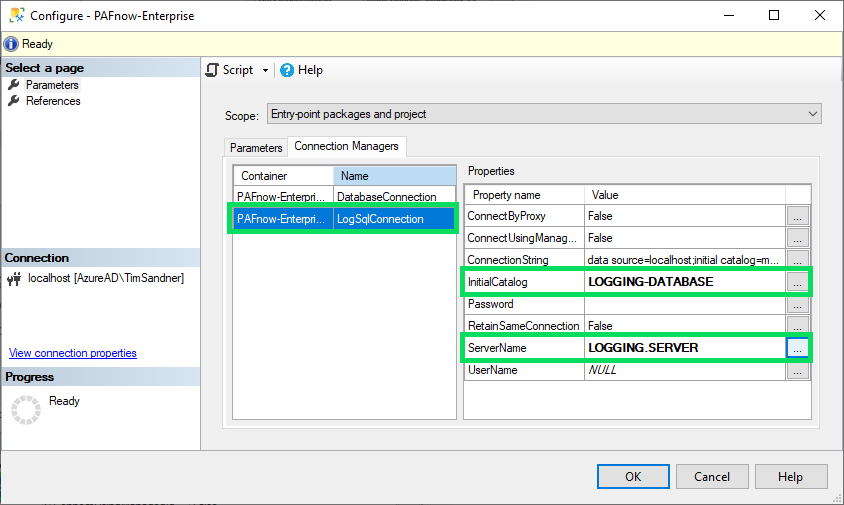
This connection determines where your logs will be written to: You could, therefore, specify the same server where your data is stored, specify some other server, or don't specify anything at all in order not to write any logs.
After the package has been executed, the logs can be found in the dbo.sysssislog table on the respetive server and database.
Please refer to Exporting SSIS Logs for detailed information on how to export created logs.
Package structure
In version 2021.3.2 the structure of the PAFnow SSIS package changed a little:
- The project now contains two seperate packages:
PAFnow-DataTransformationandPAFnow-Offline-DataTransformation - Transformation related parameters are now given on project level, while each individual package only contains unqiue parameters, e.g., UserName and UserPassword for
PAFnow-DataTransformation - The package
PAFnow-Offline-DataTransformationcan be used if you must use the offline authentication, e.g., because your server is not able to connect tologin.pafnow.com. -
The paramter
LicenseKeyhas been added for thePAFnow-Offline-DataTransformationpackage. If you need to use the offline authentication, please contact PAFnow Support about how to obtain such a license key.Note: We will only do this if there is absolutely no other way, please use the standard way of authenticating!
Hotfix 2021.3.3
A bug in the older SQL Server versions was fixed not leading to any functional changes.
January 2021
Welcome to the January 2021 release of PAFnow. The updates in this version include:
The Process Exlorer and the Case Viewer both received an update.
Process Explorer
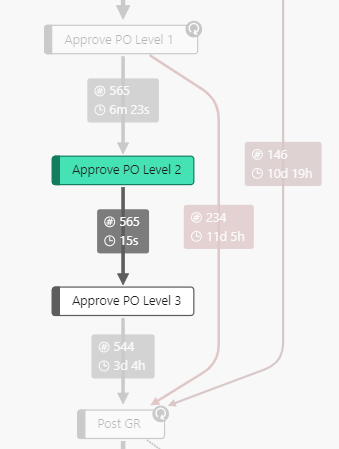
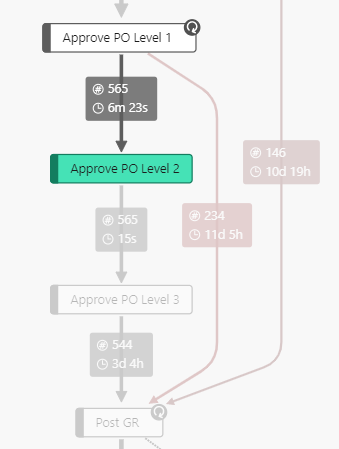
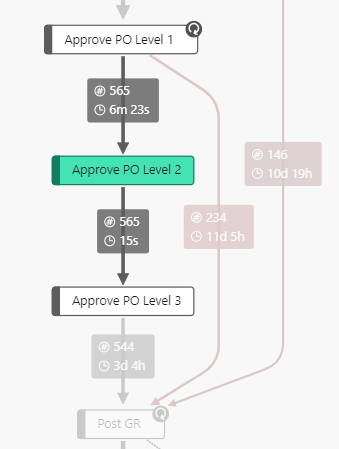
The new 2021.1-version of the Process Explorer extends the exisiting Variant Indicator with the possiblity to indicate "one-hop" instead of the "full variant". The following "one-hop"-modes are new:
| Only successors | Only predecessors | Successors and predecessors |
|---|---|---|
| Shows the successor of the process node or edge clicked | Shows the predecessor of the process node and edge clicked | Shows the successors and the predecessor of the process node and edge clicked |
 |  |  |
Case Viewer
The new 2021.1-version of the Case Viewer extends the highlight function for a event. Similar to the PAFnow Process Explorer there are many more abilities or configuration options available. The setting of Highlight Color is replaced by Low Values and High Values, further we extended it with Invert Highlight, Outlier Factor and Highlight Scale, for more information refer to here
Further we enhanced the Case Viewer-performance.
November 2020
Welcome to the November 2020 version of PAFnow. The updates in this version include:
The Process Exlorer and the Case Viewer both received a subsential performance improvement.
PAFnow Process Explorer
The PAFnow Process Explorer has been optimized and now supports a layout cache that stores the latest layouts. You can control the cache size in megabytes (MB) in the formatting area. This way, if your settings and the process graph lead to a certain layout that you have seen/rendered before, the layout will be restored from the settings, if not, it will be saved for next time.

As the diagram shows, the Process Explorer 2020.11 is about five to twelve percentage faster than the Process Explorer 2020.6, resulting in a much better overall experience. We have also updated Process Explorer to work in Internet Explorer with the same engine used in other browsers, making everything leaner.
By enabling the cache for each subsequent update for the same layout, the speed increase is even greater, from thirty one percentage to forty nine percentage. This is an improvement that is not only good for complex process flow diagrams, but also, as shown, an improvement for smaller and simpler process flow diagrams.
2020.11.2 New Slider Tooltip
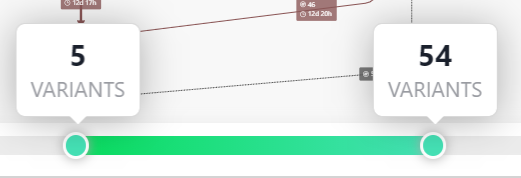
The Process Explorer now shows the number of variants as a tooltip when hovering over the slider handle or using the slider handle currently rendered by the slider. This is enabled by default, but can be turned off in the formatting pane.
PAFnow Case Viewer
The PAFnow Case Viewer has been restructured and optimized to enhance the rendering performance by using better concepts for lazy loading and virtual scroller, also the timeline zoom has been made faster. The following diagrams show the comparison between Case Viewer 2020.11 and Case Viewer 2020.8.
 As shown the initial rendering is now eightteen to fifty seven percentage better given a overall better performance.

The performance is now also much higher on the timeline zoom functionality is better than before, from forty to seventy percent, with only one label for each Event.
 Comparing these two with four labels at each Event, with a more complex calculation, it is twenty-two to seventy-five percentage better than before.
Our benchmarks showed better performance for almost all types of tasks in the newer version compared to the old version.
September 2020
Welcome to the September 2020 version of PAFnow.
PAFnow Root Cause Analyzer
The PAFnow Root Cause Analyzer got one update. You can now control the beta value of the F-beta-score function used to calculate the root causes. Setting it to a low value will favor Precision, whereas setting it to a high value will favor Recall. You can change the setting in the properties pane of the visual.
PAFnow Reports
There are some minor updates to the PAFnow reports.
- Remove drill-through from Benchmarking page - drilling with this filter will result in an empty result set most of the time
- Replace Normal Card with PAFnow Duration Card on Discovery page
- Change
Volumemeasure toCount of CaseIdin PAFnow Process Explorer - Fix bugs in bookmarks
- Change interactions to filter when possible
- Change design of event filter on conformance check page to vertical
- Update highlight on automation rate page
- We updated all visuals to the latest versions (see below)
- All reports are now compatible with the Power BI Report Server September 2019 and above
August 2020
Welcome to the August 2020 version of PAFnow.
PAFnow Case Viewer
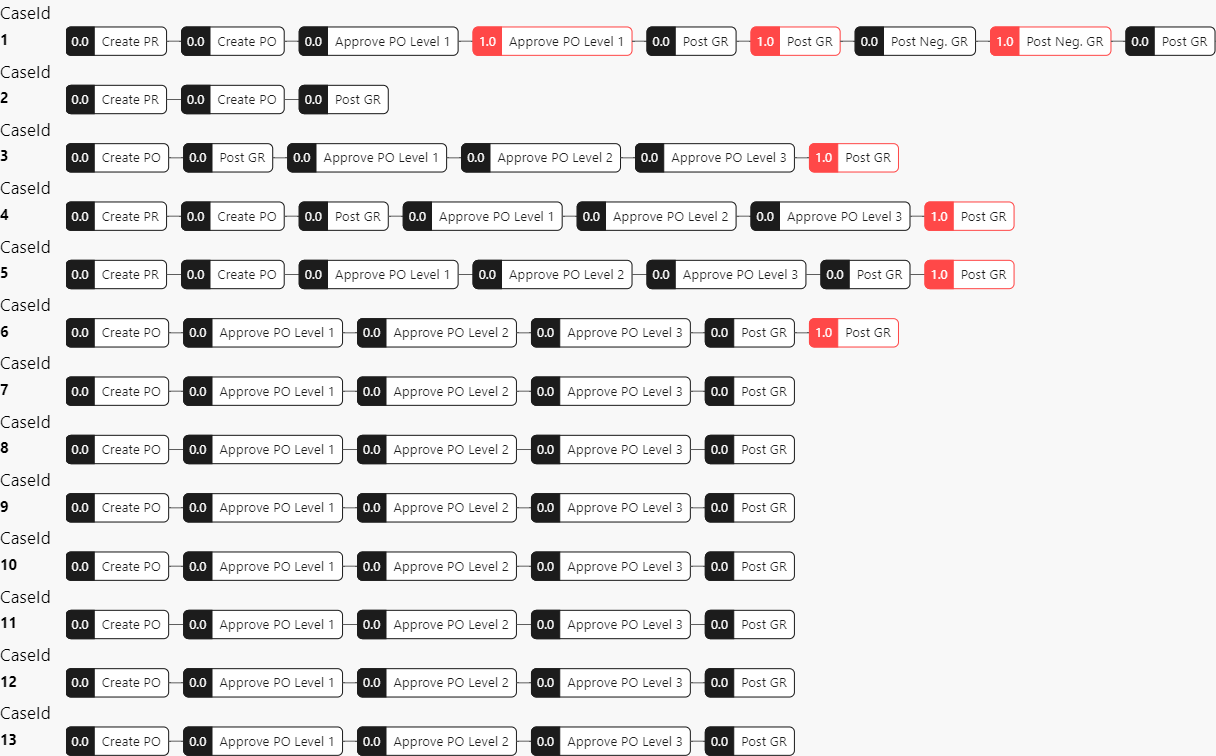
The PAFnow Case Viewer received a complete makeover. In addition to the previous functionality, that was further simplified, there are a lot of new features.
The hierarchy tree on the left is now sticky, it stays there so you know what process you are dealing with when you go all the way to the right, with many new design elements. The appearance is cleaner, the event and the highlighting color are now displayed in a separate box, with the highlighting value displayed in a similar way to the PAFnow Process Explorer nodes.
In the hierarchy form, the cases are grouped under their parent if the parent is not expanded. The event description can be expanded with event attributes.
There is also a brand new timeline feature that has four different modes and can be used by simply adding start and end timestamps that can be scaled relative to their duration or absolutely by their timestamps.
This visual has the functionality of zooming while holding down the control key, and retains the previous state, with the scroll position and expanded element.
For more check here.
SSIS package
- Implemented authentication with login.pafnow.com (28.8.2020)
- Fixed a bug with table schemas during transformation
July 2020
Welcome to the seventh PAFnow release of 2020. The updates in this version include:
| Generally | Report | Custom Visuals |
|---|---|---|
| Latest Version Guide | Event Filter | |
| Patches |
PAFnow Event Filter
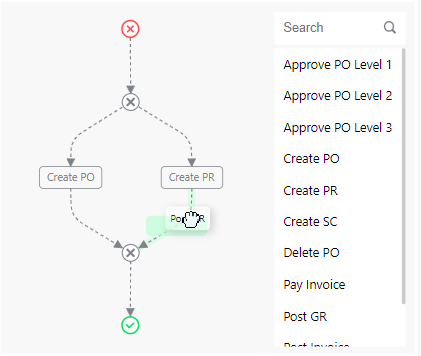
The PAFnow Event Filter got a new design, that not only allows you to analyze the order of starting points and subsequent points in your process sequence, but also the order of a sequence of steps.
The new design includes an activity list and the known graph. You can drag the activities with which you want to create the process sequences, and drop them onto the desired position of the graph.
You can change the relations between activities, by clicking on the edge to switch between directly followed (staright line) and eventually followed (dotted line) and then include or exclude the single relations.
The graph also supports two types of gateways to create alternative paths and to define the path of the sequence. You can switch between the two types by clicking on the gateway.
June 2020
Welcome to the sixth PAFnow release of 2020.
All
All visuals support now more than one port for the authentication.
Process Explorer
The Process-Explorer has received an overall performance boost and optimizations, there are the following updates:
Feature
We have replaced the "Auto Mode" settings with the "Auto Conform Variants button", which simplifies the logic and provide a better UX. Now you have more control over the reference model you want to set. This button calculates a reference model automatically for you.

Bug-Fixes:
- Use the Power BI format/type to format legend strings and data strings correctly
- Fix behavior on individual variant for values that cannot be aggregated
- Display "Not supported" instead of nothing if we are unable to calculate the correct value.
- Fix given
NaNson some random string fields. - Correct error when setting an empty standard slider value
- Fix error with label size width if no label is available for comparison
- Fix the double trigger for conformance variants while using thumbs down button to get fewer updates
- Reduce updates when using the slider
- Fix error-message with slider-filter update when changing states of slider
Mai 2020
Welcome to the fifth PAFnow release of 2020.
Companion
- Enhanced error messages in frontend
- Fix evaluation of Sort-Key
- Update preview data
April 2020
Welcome to the fourth PAFnow release of 2020.
SSIS
The highlight of the SSIS package improvement is the much faster transformation. Especially the transformation of large data is now up to four times faster than previously.
In detail the update includes:
- Implementation of new transformation, utilizing views for case creation
- A Debug table, hosting event log data about transformation
PAFnow Process Explorer
The Process Explorer got two new updates:
The new Two-Sided-Slider, see Slider: Until now it was only possible to reduce the processes complexity down to the most common Happy path. By adding a second slide control button on the left it is now also possible to reduce the processes complexity to the least common processes. The combination of both slide control buttons makes it possible to select any of the processes between these extremes.
And an enhanced navigation: It is now possible to navigate and zoom through your processes using the keyboard. The arrow icons ('↑', '↓', '→', '←') can be used for panning and zooming in or out is done with the plus or minus buttons ('+', '-'). To make the visual always reachable, we have restricted panning at the edge of the viewport. A further feature is the automatically adapting maximum zoom, depending on the size of the process graph. This way the view remains the same while zooming in to the maximum.
March 2020
Welcome to the third release of PAFnow in 2020.
Report Pages
On all pages, we added the Drillthrough functionality. You will now find in the lower left corner of every report page a treemap as well as a reset filters button.
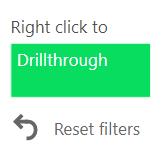
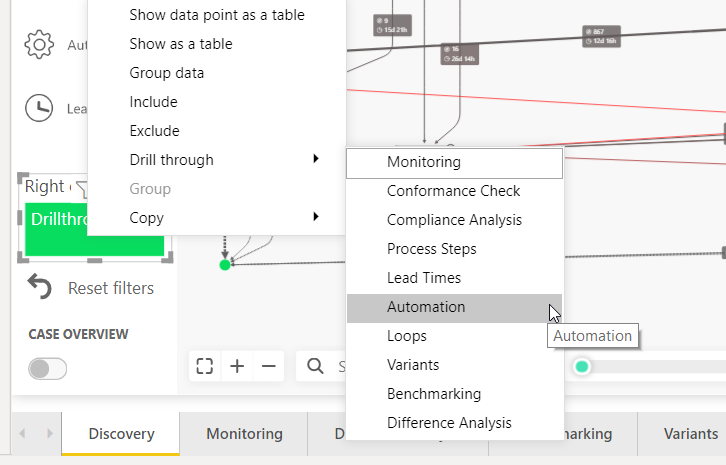
You can now drill through every other page with the selections and filters you have set on the actual page. Simply right-click on the green field, go to Drill through and select a page you want to jump to.
PAFnow Process Explorer

- We have added the ability to disable the legend colors in legend mode to also see the highlight when legend is set.
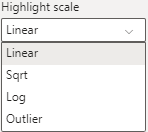
- We added different scales for the highlight modes for edges and for nodes
- Linear
- Log
- Sqrt
- Outlier
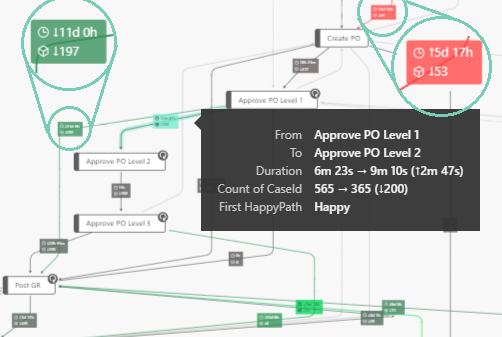
- We added the new Deviation Highlight which highlights and shows the absolute differences based on the selected data points compared to the unselected ones (similar to the Root-Cause-Analyzer). It can be activated under Advanced/Deviation Highlight.
February 2020
Welcome to the second release of PAFnow in 2020. The updates in this version include:
| Generally | Report Pages | Custom Visuals |
|---|---|---|
| Companion | - | - |
Companion
We improved the detection of file encodings in version 1.1.5 and updated the error handling.
January 2020
Welcome to the first release of PAFnow in 2020.
Companion
The PAFnow Companion in version 1.1.4 got a fix that ensures compatibility to specific customer infrastructures. It offers an experimental proxy support and moves data storage to the backend. In the future the Companion will use port 16160. Backward compatibility of the newest Companion to older PAFnow Custom Visuals is ensured through a workaround.The newest Companion offers storage of column mapping, meaning when transforming your data the Companion will remember your custom mapping for the next data transformation.
Attention
PAFnow Custom Visuals with version 2020.1 and onwards are only working with PAFnow Companion version 1.1.4 or newer! Further down you will find an overview of all the latest versions of PAFnow products for reference.
PAFnow Process Explorer
The latest version of 2020.1 enables a new sub-menu with  for conforming and
  for non conforming in the conformance-menu. To use it, you have to move the mouse over the reference model button (
 ), which allows the user to filter conforming and non conforming processes.
There are also two cosmetic improvements including the appearance of the Hide Model Move-icon (from release 2019.2) and the customizable color theme, which now also applies to the Conformance Menu-button.
The performance measurement Fitness Indicator is now calculated in a more precise way; for details please refer to the Fitness Indicator in the Process Explorers Conformance Check.
Also new is the tooltip upon hovering over the Fitness Indicator Result Donut, showing clearer information on your process flow and process fitness.
December 2019
Welcome to the 2019.3 release of PAFnow.
Performance Enhancement
PAFnow 2019.3 got various background modifications to enhance performance and user experience.
PAFnow Process Explorer
The Process Explorer got three new changes:
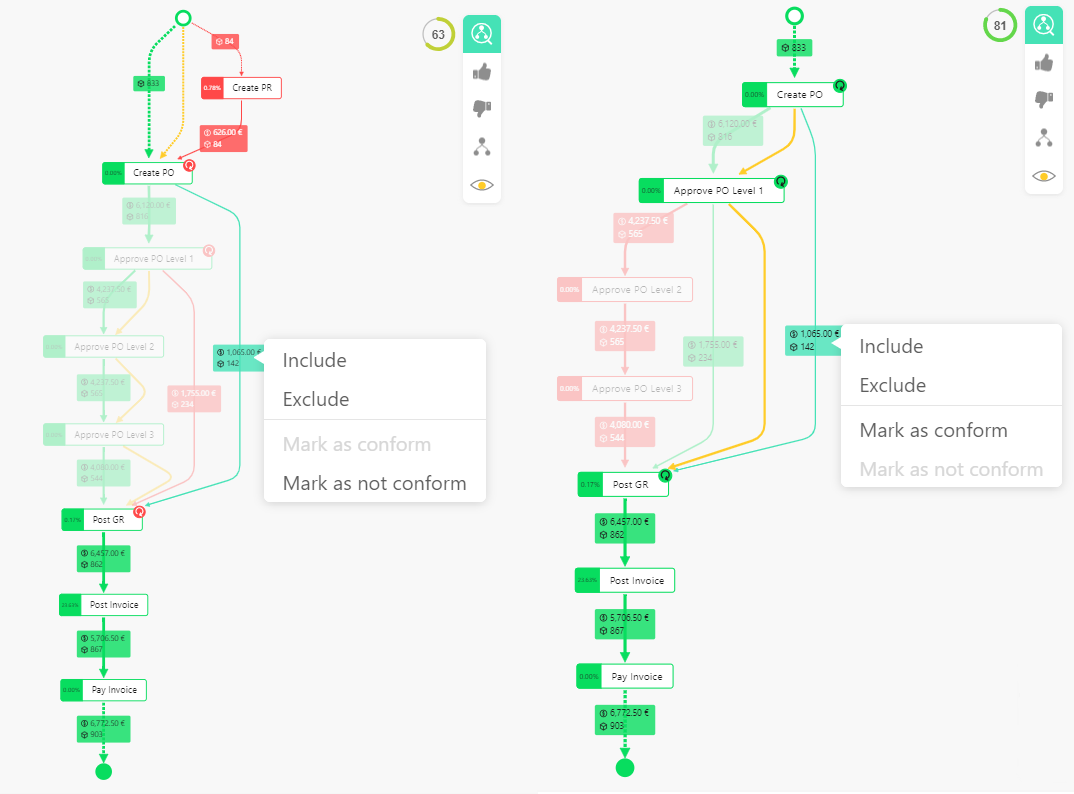
- The conformance model can now be built via the context menu
Conformance Check with context menu
The reference model can be easily modified by selecting one or more (with CTRL) paths and processes from the context menu and marking the corresponding variants via right-click as conform or not conform.
-
Additional result information was added as a tooltip to the conformance check, to make better interpretations possible
-
And lastly we have added the support for Microsoft Power BI - Report Tooltip to our PAFnow Process Explorer. More detailed information can be found on the Process Explorer Page
Attention
The report page tooltip is only applicable to edges and not to nodes.
November 2019
Welcome to the 2019.2 release of PAFnow.
PAFnow Companion v1.1.0
Our new PAFnow Companion uses a more customer friendly way to transform any uploaded *.csv-event log. The configuration-step is added that allows you to change data types and column mapping of your uploaded file, see Transformation. This way you do not need to fulfill the naming conventions previously set by our Event Log Specifications if your data is usable beyond that.
Configuration in Companion
 On the left side the hook confirms that said data is given for the transformation. The bold written names are the column names found in your data set. In the middle an exemplary data extract shows what kind of data was found in your data set under said column. The right side of the table states which column from our specification and therefore also which expected data type your data is mapped with during the transformation. A first mapping of data is done automatically taking column names, content and data types of your
 *.csv-file into account. In the recommendation, every mandatory column not yet mapped appears if it is not found and mapped automatically.
Completely customized mapping is possible if the basic requirements are fulfilled, so that the transformation can be completed successfully. An error-message should tell you which criteria were not met so you can correct them.
SSIS
A new patch SSIS 2019.1.2 for customers of PAFnow Enterprise is available.
PAFnow Report
All reports used in the different packages (i.e. PAFnow Pro, PAFnow Premium and PAFnow Enterprise) are up-to-date with the new visuals and now support the newest version of our PAFnow Companion (v1.1.0). Some minor adjustments in the appearance of some visuals have been done (mainly regarding font sizes of our Custom Visuals).
PAFnow Custom Visuals
PAFnow Process Explorer
The Process Explorer has two new features, firstly the Filter Preview and secondly the Show/Hide-button for model movements.
Filter Preview
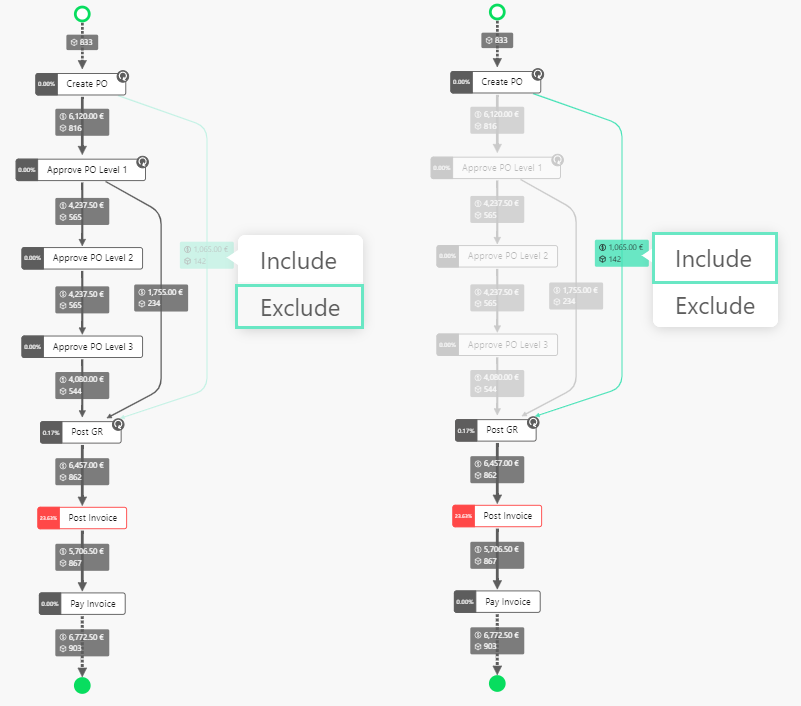
In the new version of the Process Explorer you get a filter preview while you move the mouse over the intended filter in the context menu.
Show/ Hide Reference Model
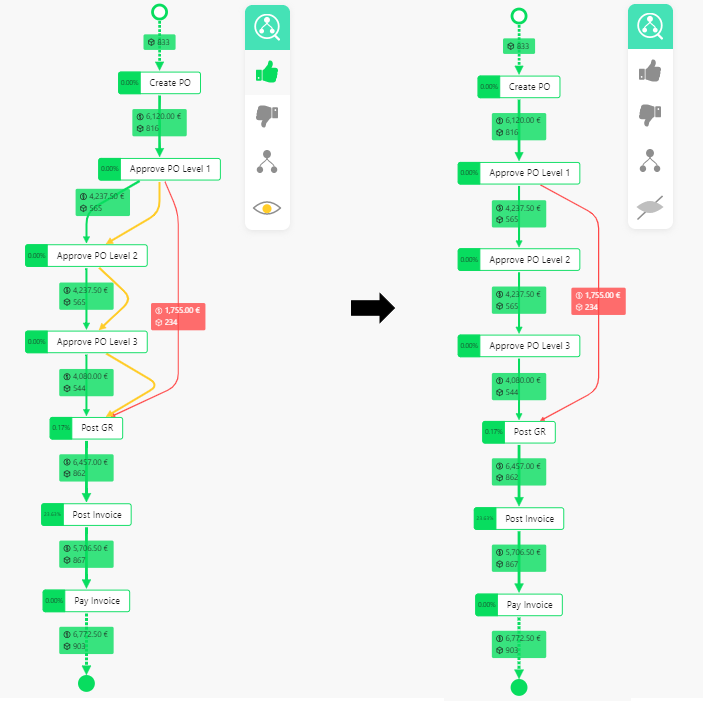
As a second new feature you can now show or hide the movements of the reference model using the show/hide-button in the extended conformance menu.
PAFnow Histogram Slicer
Negative Values in Histogram Slicer
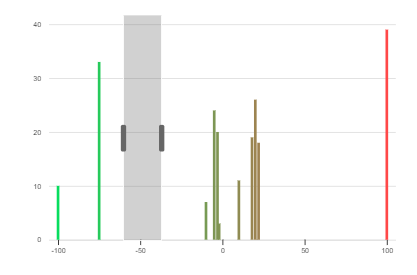
Negative values on the x-axis are now supported in our newest version of the Histogram Slicer.
Snap Near Values

Now you can also use a new function available through a switch-button in the visual-settings, allowing you to snap to the nearest values you have selected.
PAFnow Duration Card
A new patch Duration Card 2019.1.2. is available with some bug fixes.
October 2019
Welcome to the 2019.1 release of PAFnow.
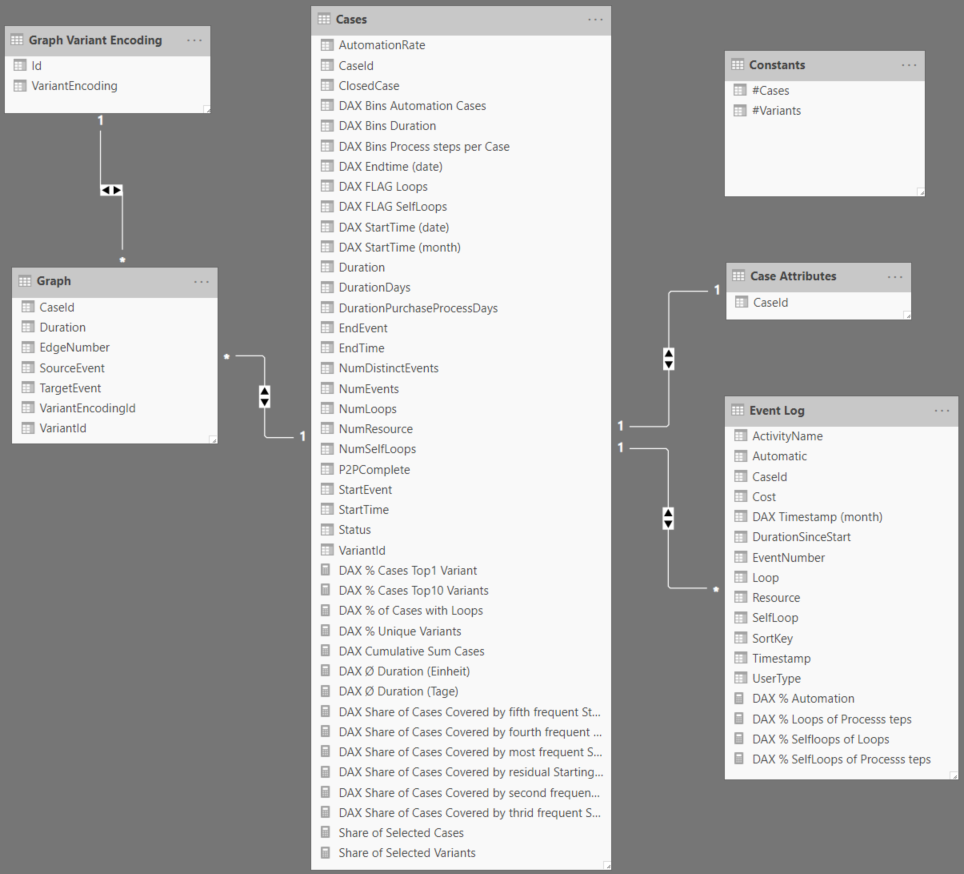
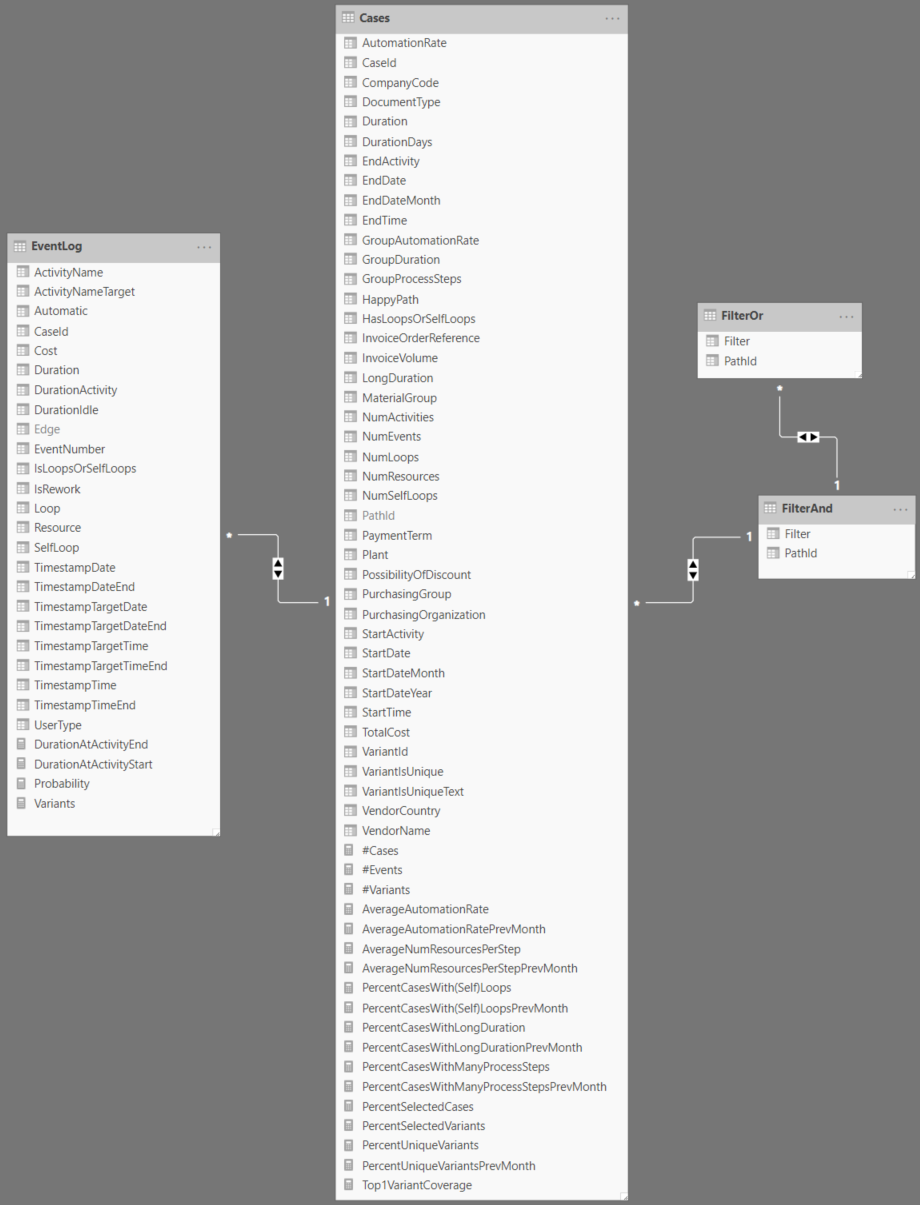
PAFnow Data Model
In PAFnow 2019 the data model was reduced from previously six tables to now two main tables Cases and Eventlog and two helping tables enabling you to apply filters.
Cases and Eventlog as the two main tables remain but are now expanded with additional columns. A total of 11 columns were newly added and 11 changes were done in existing columns in Cases. In Eventlog 18 columns were added and four changes were done.
As a consequent the process graph as seen in the PAFnow Process Explorer is now built directly from the two main tables without needing the therefore redundant Graph Variant Encoding and Graph tables. Case Attributes was included as Data Analytics Expression (DAX) in the new Eventlog.
The two new tables FilterAnd and FilterOr enable you to apply specific filters in the PAFnow Custom Visuals.
Detailed data model changes
Reference data models
Data model from PAFnow 2018.2 :
Data model from PAFnow 2019.1 :
| Table name | Column name | Change type | Table name | Column name | Change type | |
|---|---|---|---|---|---|---|
| Cases | EndActivity | renamed | Eventlog | ActivityNameTarget | new | |
| Cases | EndDate | new | Eventlog | Duration | new | |
| Cases | EndTime | new | Eventlog | DurationActivity | new | |
| Cases | HappyPath | new | Eventlog | DurationIdle | new | |
| Cases | NumActivities | renamed | Eventlog | EventId | new | |
| Cases | PathId | new | Eventlog | Loop | Logic change | |
| Cases | StartActivity | renamed | Eventlog | SelfLoop | Logic change | |
| Cases | StartDate | new | Eventlog | Source | new | |
| Cases | StartTime | new | Eventlog | Target | new | |
| Cases | TotalCost | new | Eventlog | TimestampDate | new | |
| Cases | EndActivity | renamed | Eventlog | TimestampDateEnd | new | |
| Cases | #Cases | new [DAX] | Eventlog | TimestampTargetDate | new | |
| Cases | #Events | new [DAX] | Eventlog | TimestampTargetTime | new | |
| Cases | AverageAutomationRate | new [DAX] | Eventlog | TimestampTime | new | |
| Cases | EndDateMonth | modified [DAX] | Eventlog | TimestampTimeEnd | new | |
| Cases | GroupAutomationRate | modified [DAX] | Eventlog | #Edges | new [DAX] | |
| Cases | GroupDuration | modified [DAX] | Eventlog | DurationSinceStart | modified [DAX] | |
| Cases | GroupProcessStep | modified [DAX] | Eventlog | Probability | new [DAX] | |
| Cases | PrecentSelectedCases | modified [DAX] | Eventlog | StartVolume | new [DAX] | |
| Cases | PrecentSelectedVariants | modified [DAX] | Eventlog | Timestamp | modified [DAX] | |
| Cases | PrecentUniqueVariants | modified [DAX] | Eventlog | Variants | new [DAX] | |
| Cases | StartDateMonth | modified [DAX] | Eventlog | VariantVolumes | new [DAX] | |
| Cases | Top1VariantCover | modified [DAX] | ||||
| FilterAnd | PathId | new | FilterOr | PathId | new | |
| FilterAnd | Filter | new | FilterOr | Filter | new |
PAFnow Companion
The completely new PAFnow Companion is the binding element between Microsoft Power BI and PAFnow and accelerates the transformation of your event log or .csv-file for its utilization in PAFnow. Please note that the csv.-file needs to be following our PAFnow Event Log Specification to be transformed correctly.
The transformations output can be directly imported into the PAFnow Standard Report template using the combination of Path and Prefix generated by the Companion from your original data. Outsourcing the transformation to your memory makes the transformation take less time and improves performance.
As the Companion is in charge of verifying your license validity it needs to be running in the background constantly when using PAFnow or reports including Custom Visuals.
The home screen of the Companion looks different depending on your PAFnow license type and will allow you to start data transformation only if you have a PAFnow Report Developer license.
PAFnow Report pages
New Layout
In general the PAFnow Standard Report has received a complete makeover.
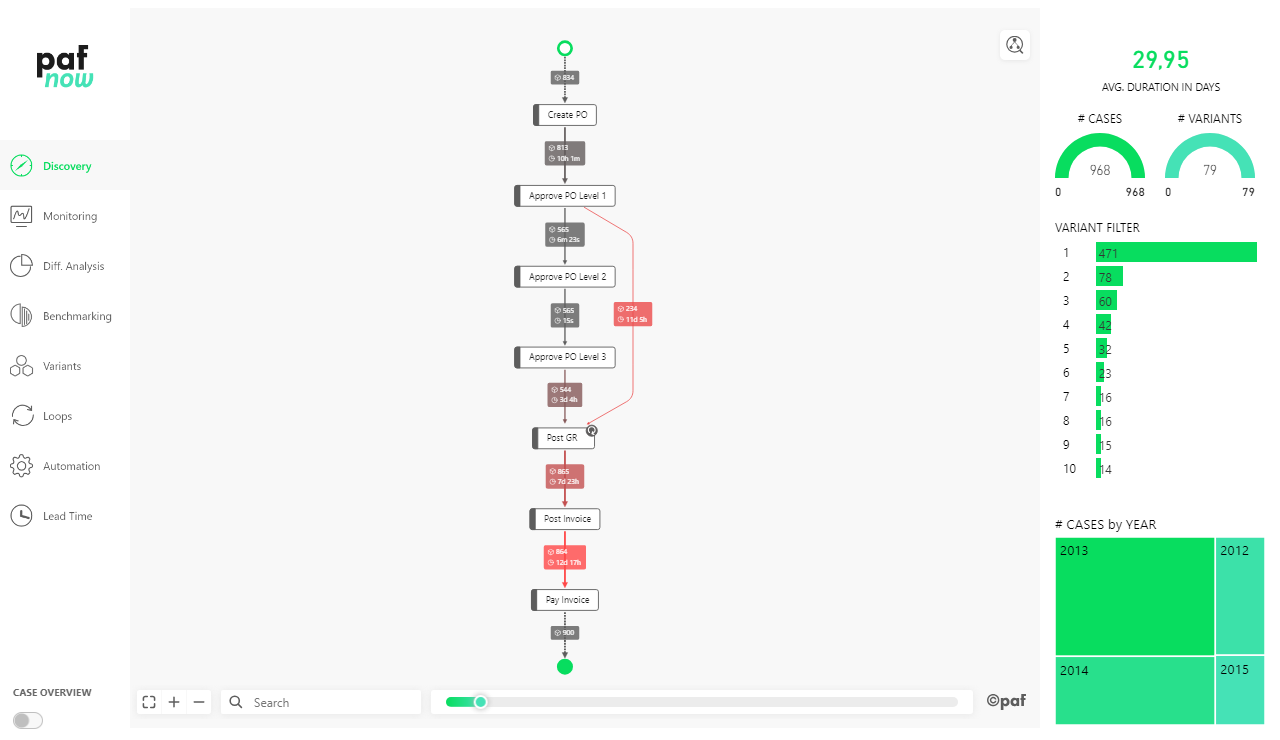
A pane on the left becomes the menu, listing the most important report pages and leaving space for your customized or own report page. The report page you are currently working on is highlighted in green. In the lower left corner a switch-button can be found if the report page allows you to switch views (PAFnow Discovery, PAFnow Lead Time Calculator and PAFnow Process Steps)
The navigation bar, for most report pages including the filter visuals, can be found on the right pane without a direct separation from the other visuals, leaving more space for the main custom visuals in the center of the page.
Depending on your usage of PAFnow in edit or view mode in the bottom or left side you can see an overview of all report pages.

Monitoring
The PAFnow Monitoring Page provides an overview of your processes and showcases all relevant key figures and trend analyzes. It replaces the Overview Page used in PAFnow 2018.2.
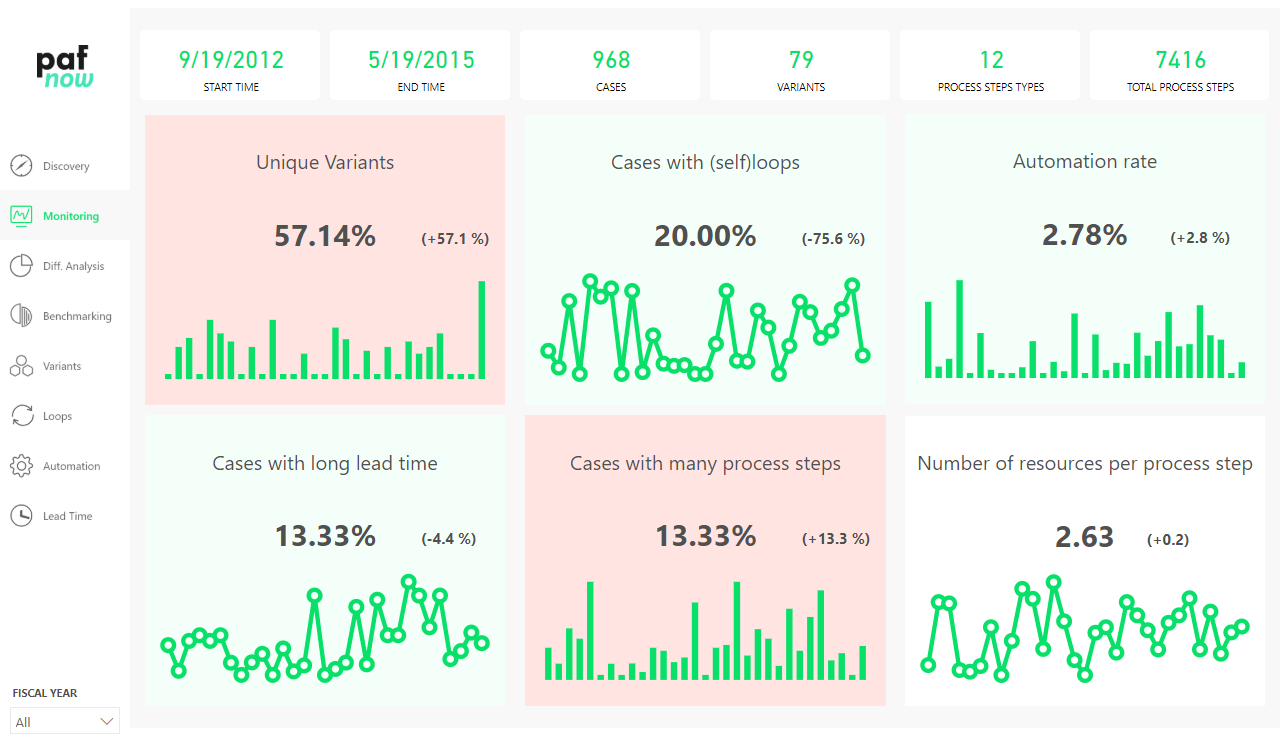
Monitoring consists of six monitoring cards visualizing the development of different relevant process mining KPIs.
Difference Analysis
As a new report page the PAFnow Difference Analysis helps you to start your in-depth analysis by comparing key figures in process paths.
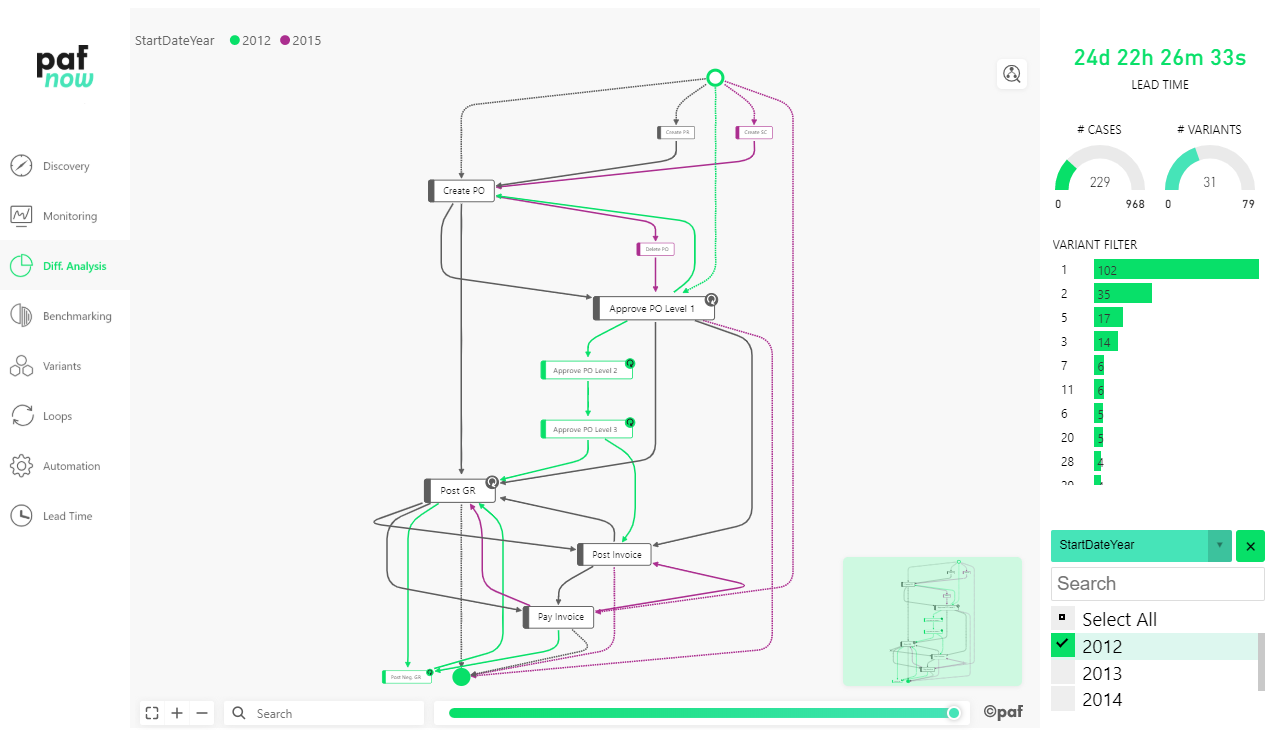
Process variants and differences in processes in relation to a specific attribute are outlined. You can control the process flow for a further deep analysis using the navigation pane on the right side. Using the PAFnow Attribute Filter you can see the behavior of your process for a specific attribute selection.
Variants
PAFnow Variants replaces the Starting Points report page. 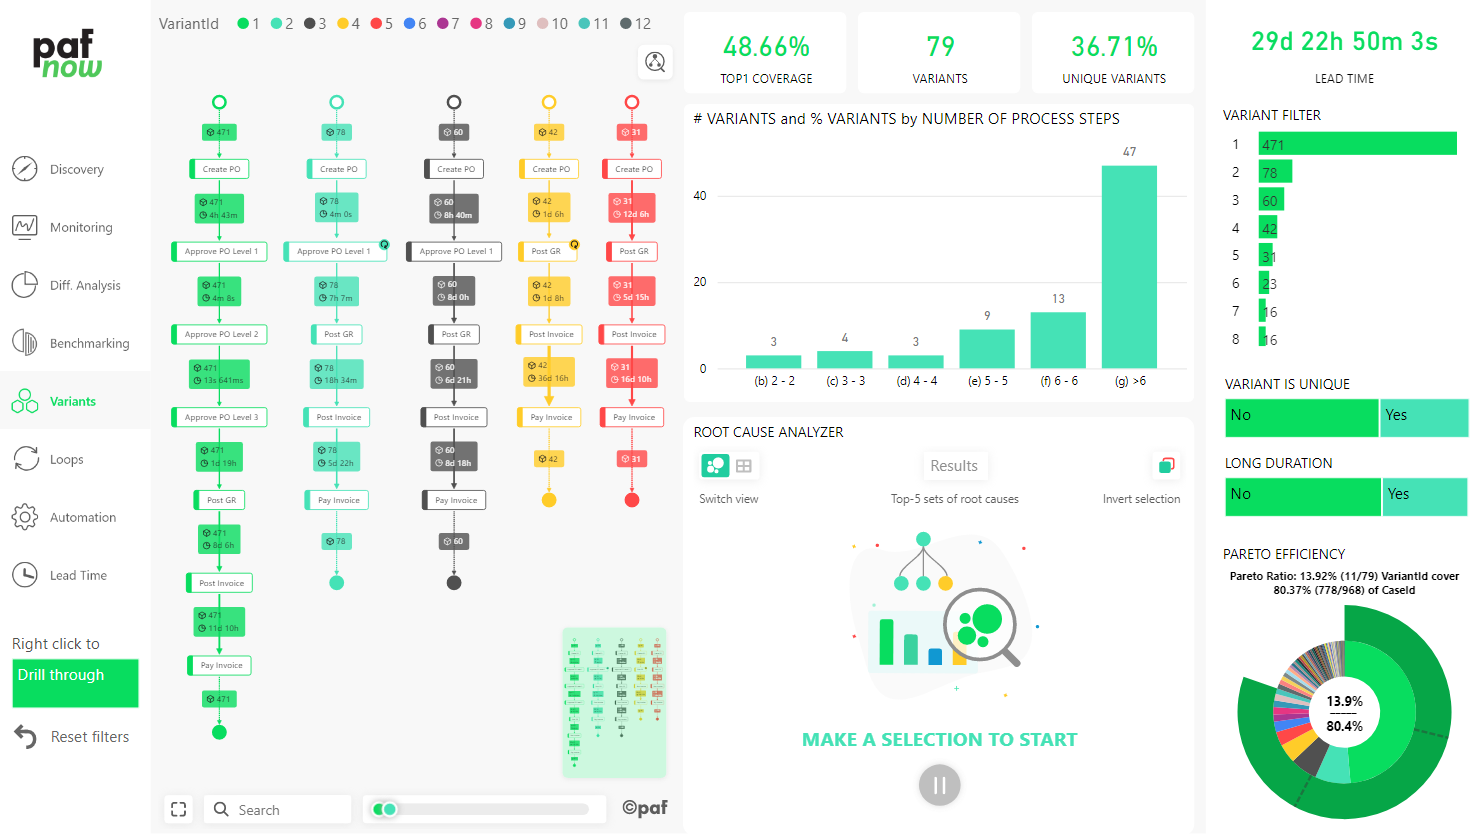
Using the improved PAFnow Process Explorer individual variants of process sequences from start to end can be showcased in a more user-friendly way. This side-by-side presentation allows you to compare the selection at a glance.
Lead Time Calculator
The PAFnow Lead Time Calculator Page known from the PAFnow Content Pack Reports is now also available as a page in the Standard Report. Focus of the page are analyses based on the duration of specific cases and variants.
Compliance Analysis
The PAFnow Compliance Analysis Report Page replaces the Case Viewer Page. Compliance Analysis allows you to review sequences of process steps and note anomalies on the first view.
Compliance Analysis Report Page
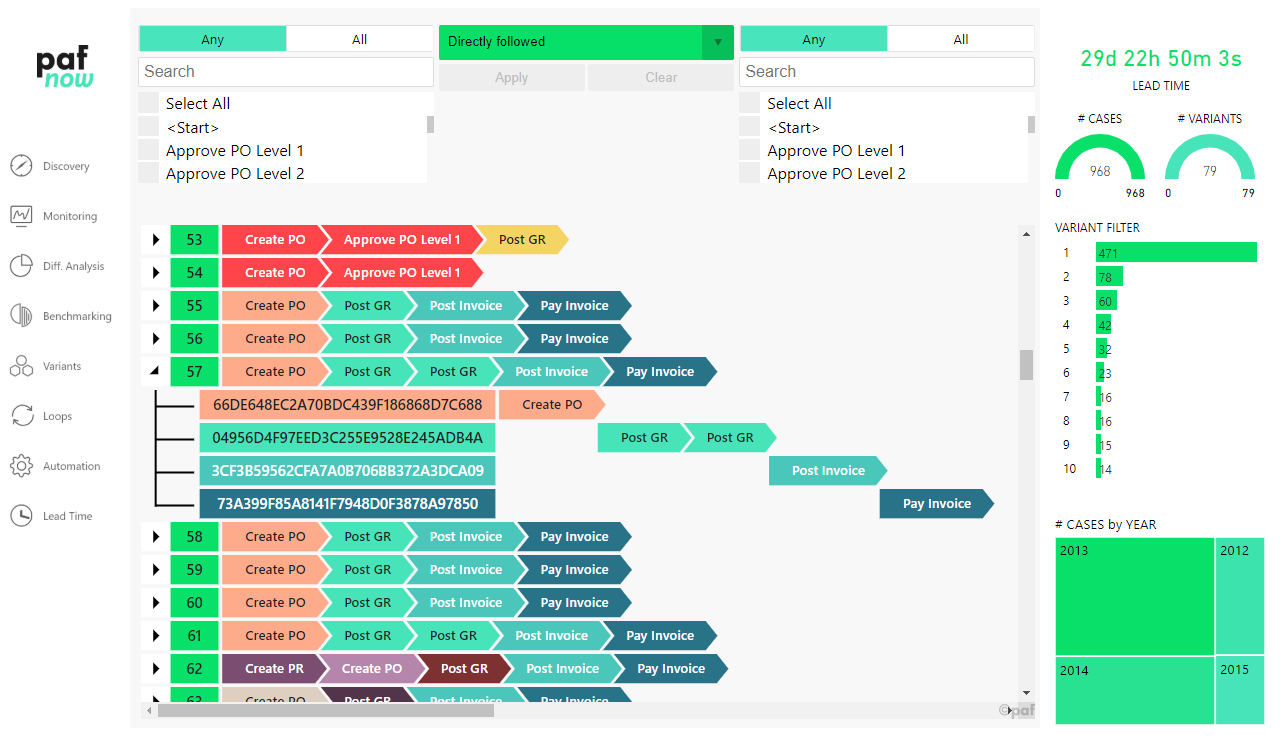
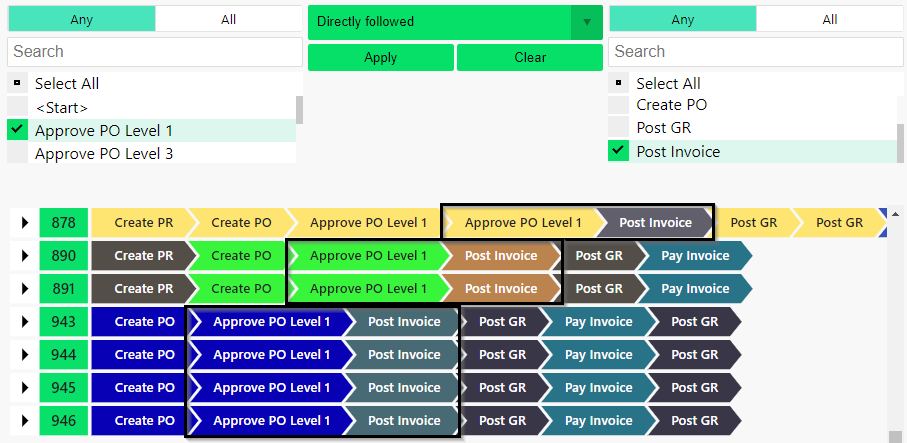
Compliance violations in your process can be found when looking not only at individual process steps but their sequence. All relevant changes in display of the PAFnow Case Viewer custom visual can be found under PAFnow Case Viewer. Supplementary in the reworked report page you can now find the PAFnow Event Filter to filter the Case Viewer Visual following a certain process sequence:
Conformance Check
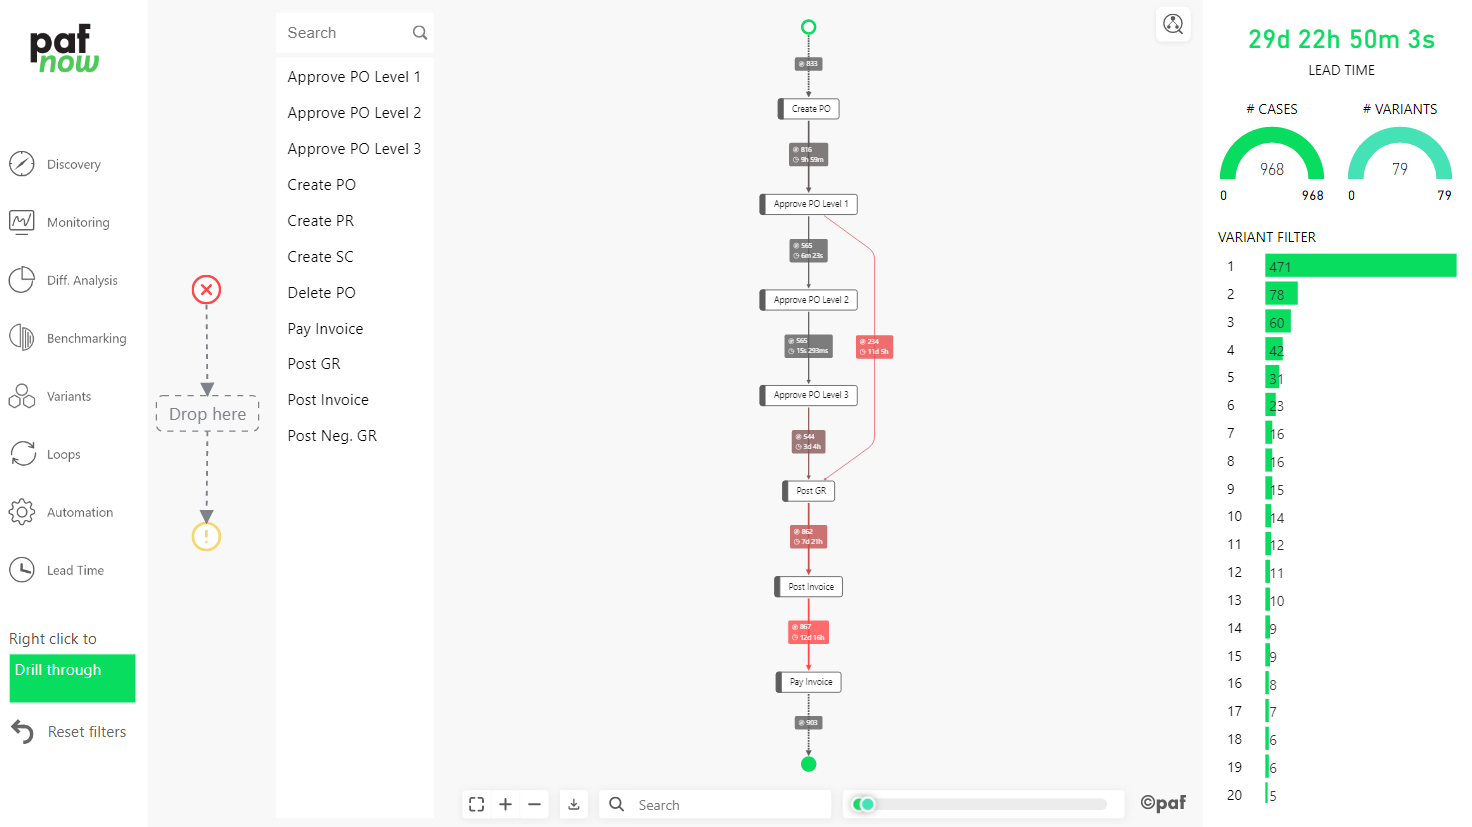
The PAFnow Conformance Check allows you to compare the as-is process with a target model and thereby make compliance issues visible:
Conformance Check with Event Filter
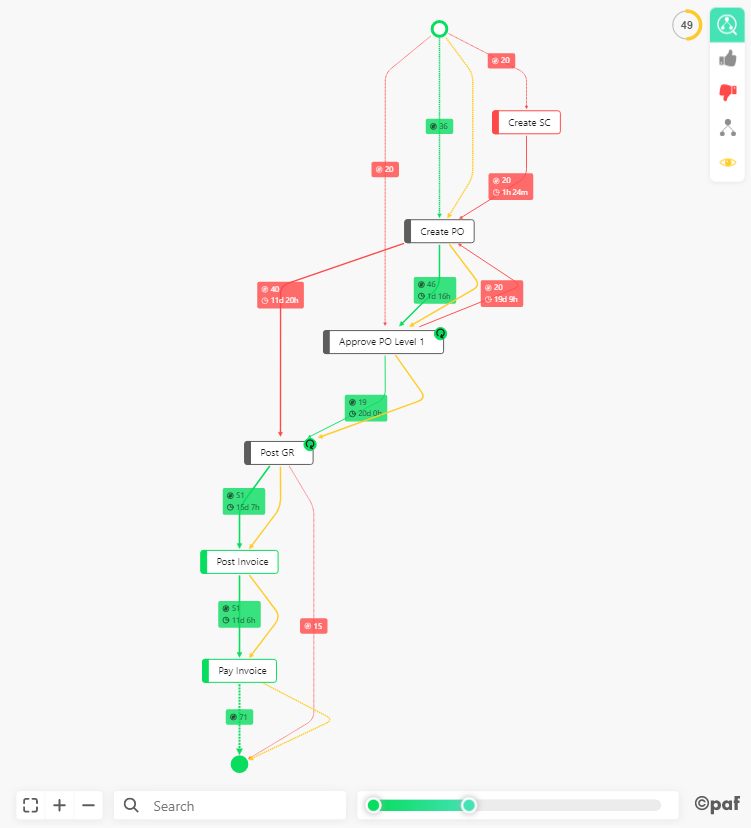
When analyzing the order of process steps, deviations or compliance issues can be found using the PAFnow Event Filter. Using the new highlight features of the Process Explorer variants and cases that do not conform to the rules set for your process are shown in red:
PAFnow Custom Visuals
GUI localization
for Process Explorer, PAFnow Lead Time Calculator, Event Filter and Attribute Filter:
These four PAFnow Custom Visuals now support English and German language. The content of these visuals can now be localized to the desired language.
Process Explorer
Additionally to the tooltip that shows additional numerical and temporal information about the selected element, the Process Explorer has many new and mighty features explained below. The new Process Explorer includes the features of the visual previously known as PAFnow Process Viewer.
Features
Process Explorer Slider
A slider that adds or removes variants to the displayed process model was implemented to make the Process Explorer more user-friendly.

All variants are included when the slider is on the far right. Sliding to the left will remove variants starting with the variant with the smallest volume up to the variants with the biggest volume on the far left.
Process Explorer Filter Pane
A filter pane with three types of filters, that can be set at the same time via right-clicks on individual process steps, was implemented.
 Include All-filter
 Include Any-filter
 Exclude-filter
 You can delete a single filter by clicking on the x-button when hovering over a set filter:

To remove all filters of one type, hover over the type you want to clear and click the trash-can-symbol:

To remove all set filters, hover over the filter icon itself and click the trash-can-symbol:

Conformance Check
You can now use the Process Explorer to do a conformance check of your processes.  To do so, activate the Conformance Mode by clicking the loupe-icon on the top right of the visual or stop it with another click. When started for the first time the Conformance Mode will automatically mark the variants as conform that cover 80 percent of the cases; this Auto Mode-conformance can be de-activated through a switch in the format settings. Afterwards the last saved model is used for future conformance checks.
Conformance Check and Reference Model
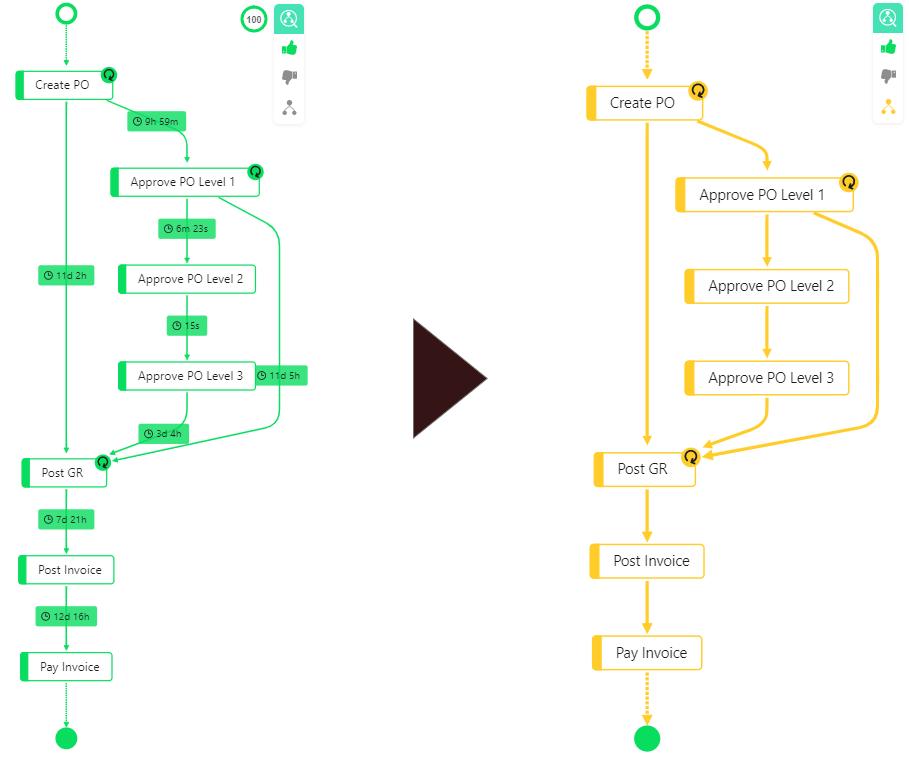
In the Conformance Mode you can now move the slider or set filters in your menu to mark your individual variants as conform  or not conform
  . The number in the circle is the percentage of cases marked as conform. To see your current reference model you have to press the forking-button
  in the menu.
Multi Graph Layout
As a new feature you can now add a legend to activate distinct ways of visualizing the process sequences:
- Side-by-Side: Multiple process flows are visualized next to each other depending on their legend.
- All-in-One: One process flow is visualized with multiple paths passing by the individual process steps.
- Unique Highlight: A single process flow is visualized in multiple paths highlighting unique legend values.
Example Side-by-Side
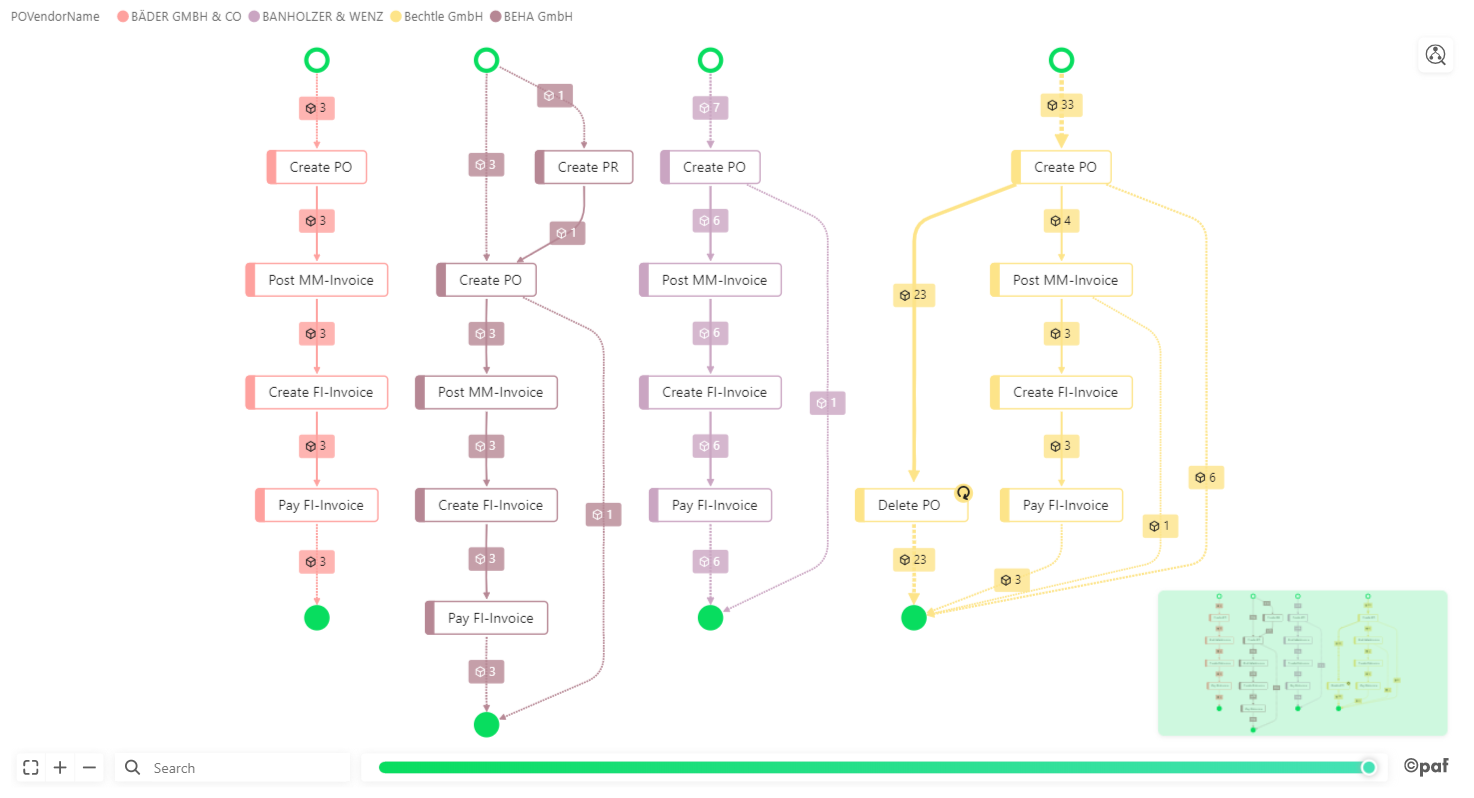
Side-by-Side layout of the same process flow in comparison when executed by individual vendors
New fields
| Name | Type | Replaces (Name in 2018.2) |
|---|---|---|
| Source | Categorical | - |
| Target | Categorical | - |
| Edge Volume | Numerical | new |
| Variants | - | |
| Edge Labels | Any | Duration Attributes and Numerical Attributes |
| Node Tooltips | Any | new |
| Legend | Categorical | new |
| Edge Thickness | Numerical | Thickness |
| Edge Highlight | Numerical | Highlight |
| Node Size | Numerical | new |
| Node Highlight | Numerical | new |
| Filters | - | new |
Fields no longer needed: Encoding Values and Node Category
Case Viewer
Hierarchy functionality with drilldown/ expand
With this new functionality you can drilldown in the visual or expand more information to explore details about your cases. The process flows are grouped according to the current level in the hierarchy. Each level provides new insights into your processes based on a single attribute (e.g. country, vendor, case ID…).
Drilldown and Expand
Drilldown/ -up works by pressing the drilldown ![]() or the drillup-button
or the drillup-button ![]() to go up or down a layer in your hierarchy and display new information in each layer. To enable the drilldown functionality the disabled arrow-icon
to go up or down a layer in your hierarchy and display new information in each layer. To enable the drilldown functionality the disabled arrow-icon ![]() needs to be clicked to turn-on enabled mode
needs to be clicked to turn-on enabled mode ![]() :
: 
Use the expand-button ![]() to create additional sequences of processes grouped by the extended
to create additional sequences of processes grouped by the extended Case Identifier. Clicking the arrow-icon ![]() opens lower levels and gives you detailed information about your process:
opens lower levels and gives you detailed information about your process: 
Swimlane Representation
The Swimlane representation is enabled when using legend. Each lane describes a legend value and displays the sequence of the executed events in groups by the same color or between groups by different colors.
Swimlane

New design
As extension to the swimlane representation, the color of the case identifier and event label text are set to the right color automatically. This way their legends always remain readable when changing the background color(e.g. of case identifier box and event label box).
Text font and size configuration
Additionally the customization of text font and size are enabled using the property pane.
Lead Time Calculator
New design for the buttons
The Lead Time Calculator Visual now works using new fields. To enhance the usability of the visual, the text-fields are now replaced with icons.
| Earliest | Average | Latest |
|---|---|---|
 |  |  |
Tooltips for the icons
You can also hoover the cursor over an icon to display the replaced text information.
![]()
New fields
| Name | Type | Replaces (Name in 2018.2) |
|---|---|---|
| Variant | Numerical | - |
| Activity | Categorical | - |
| Event Number | Numerical | - |
| Duration since Start | Numerical | - |
| Count of CaseId | Numerical | Variant Weight |
Attribute Filter
Drilldown/-up and expand functionalities
With the drilldown/-up functionality you simply get access to the attributes you want to filter by. You can also use the expand functionality to add more attributes from your selection to the drop-down-list and further select them directly from the drop-down-list.  To select the next attribute use
 ![]() To switch to the previous attribute use
To switch to the previous attribute use ![]()
 Your drop-down-list shows PaymentTerm. To see additional attributes in the drop-down-menu, select
 ![]() .
.
Duration Card
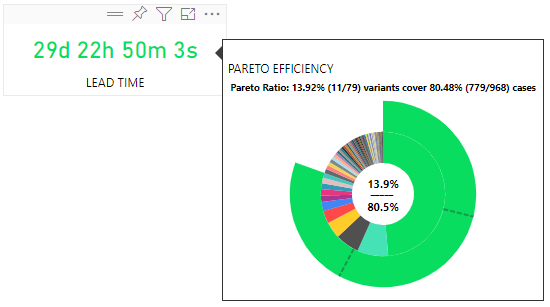
PAFnow Duration Card now supports report page tooltip. With the report page tooltip functionality you can design a report page and use it as a tooltip when hoovering over the PAFnow Duration Card. For further information have a look at the information on report page tooltip from Microsoft.
Histogram Slicer
The PAFnow Histogram Slicer got a few bug fixes in the new PAFnow 2019.1. The drilldown and expand-functionalities are also available for this Custom Visual.
Root Cause Analyzer
The PAFnow Root Cause Analyzer got a complete makeover and has a new feature which enables you to interpret the results of your analysis of root causes more better and more detailed.
New UI/UX design
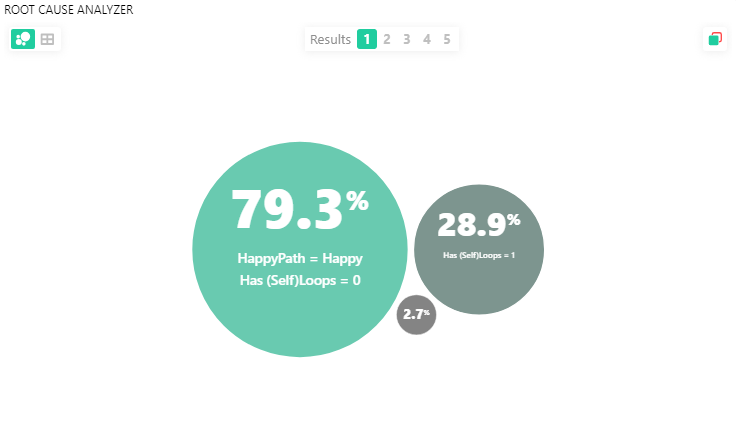
The new design of the PAFnow Root Cause Analyzer consists of a bubble chart that will display the five most likely root causes for your selection. The drilldown and tooltip functionalities also work in the visual.
Root Cause Analyzer
By clicking the corresponding Results-button the five main explanation-combinations of the root causes are displayed:
Tip
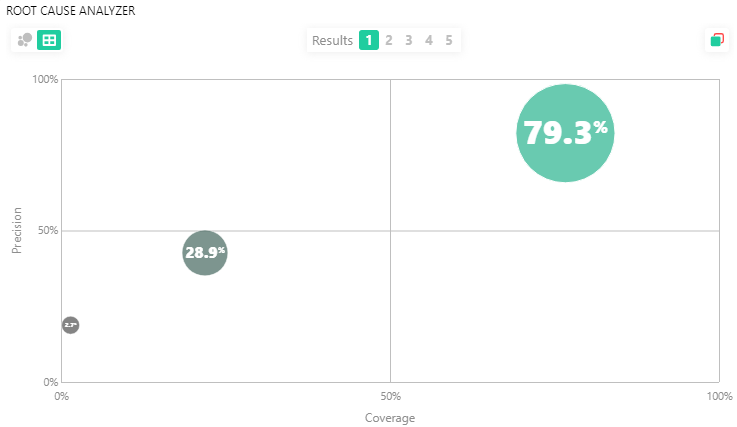
In addition to the display as a bubble chart the single bubbles can be re-arranged in a scatter matrix to show probability of the shown explanation. In the new Root Cause Analyzer the probability is assembled using both precision and coverage of the explanations bubble:
Inverse selection mode
You can now switch to the inverse selection-mode to analyze the root causes of the inverse selection. To activate this mode you just have to click the red-square-button on the top right corner of the visual.
Root Cause Analyzer inversion
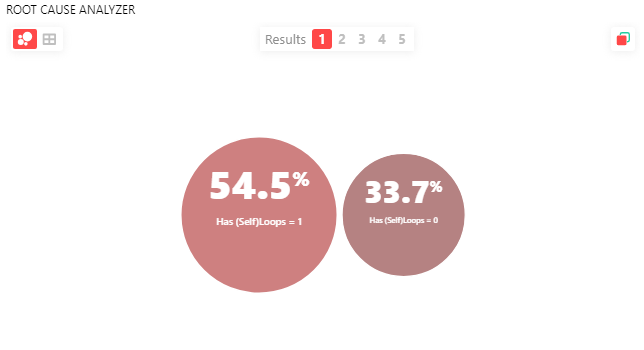
The same functionalities and display options are available for the inverse selection mode of the Root Cause Analyzer.
New fields
| Name | Type | Replaces (Name in 2018.2) |
|---|---|---|
| Count | Numerical | Number of Cases |
| Explain by | Any | Attributes |
Document Flow
New fields
| Name | Type | Replaces (Name in 2018.2) |
|---|---|---|
| Objects | Any | - |
| Case Identifier | Any | new |