PAFnow Lead Time Calculator
The evaluation of lead times is often at the center of process analyzes. The PAFnow Lead Time Calculator allows you to determine lead times for individual sections of your process. You can choose the measuring points flexibly, to comprehend where exactly a process gets caught. The Lead Time Calculator is part of the Lead Time Page in your report.
For an introduction to the PAFnow Lead Time Calculator visual later than version 2020.6 click here.
This is the icon of the PAFnow Lead Time Calculator in the Visualizations pane:
![]()
How to get started
Before you can start any lead time calculations with the PAFnow Lead Time Calculator, you first have to drag the required fields into the respective buckets.
Example
Drag-and-drop the following columns into their buckets:
Variant: Drag-and-drop VariantId from the Cases table into the Variant bucket located under Visualizations.
Activity: Drag-and-drop ActivityName from the Event Log table into the Activity bucket located under Visualizations.
Event Number: Drag-and-drop EventNumber from the Event Log table into the Event Number bucket located under Visualizations.
DurationAtActivityStart: Drag-and-drop DurationSinceStart from the EventLog table into the Duration Since Start bucket and select Average in the drop-down-menu.
Count of CaseId: Drag-and-drop CaseID from the Cases table into the Count of CaseId bucket and select Count (distinct) from the drop-down-menu.

How to use
Once you have selected the required fields for the PAFnow Lead Time Calculator, you can start to flexibly calculate the lead times for individual process sections.
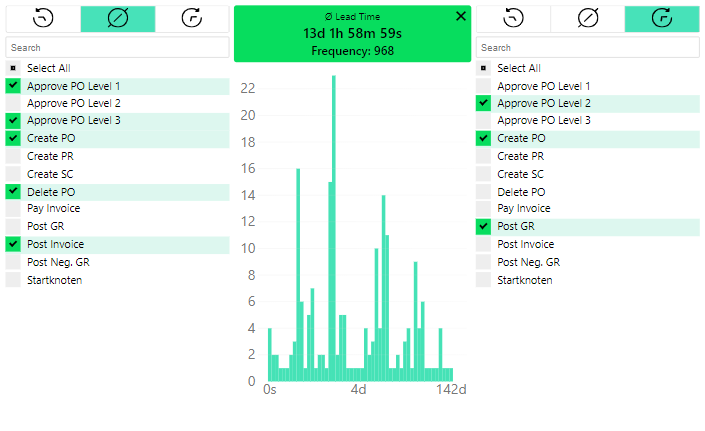
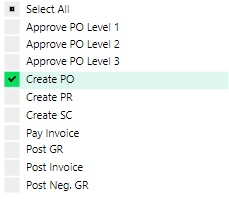
Left Selection List
You can add one or several activities as starting points of your lead time calculation. These are listed in the selection list on the left side of the PAFnow Lead Time Calculator (in this example the activity Create PO). To add an activity, you can select it by clicking on the activity in the list. Select all activities you want to add as starting point to the calculation. Alternatively, you can click-and-drag or press Shift and click to select a sequence of activities and add them to the selection list.
Tip
If you want to select all activities, click Select All.
You can also search for activities by name using the search bar. 
Time Box
If your chosen starting or ending activity/activities, appear multiple times in your process sequence, you can adjust which activity you want to set as your starting point. You can choose between three types:
| Earliest | Average | Latest |
|---|---|---|
 |  |  |
Right Selection List
Similar to the selection of the starting points you can select one or multiple activities as the endpoint of the lead time calculation (here, for example the activity Delete PO). Please refer to Left Selection List for all options on how to add activities. 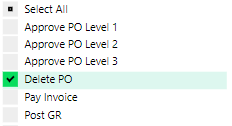
Tip
If you want to select all activities, click Select All.
You can also search for activities using the search bar.
Average Lead Time
In the box between the two selection lists you can see the average lead time for your activities section and the frequency of the pattern in your process sequence: 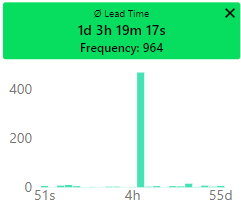
In this example 1 day 3 hours 19 minutes and 17 seconds! Delete the selection by pressing the  on the top right.
Distribution of cases
The bar chart underneath this box shows the distribution of average lead times by variants for the selected process section. That way, you can see what lead times the majority of the cases have and if there are outliers in your process.
Specification
Required Fields
In order to use the Lead Time Calculator, you have to drag the required fields into the respective buckets.
| Name | Type | Description |
|---|---|---|
| Variant | Numerical | Use the VariantId field from the Cases table. |
| Activity | Categorical | Use the ActivityName field from the EventLog table. |
| Event Number | Numerical | Use the EventNumber field from the EventLog table. |
| Duration Since Start | Numerical | Use the DurationSinceStart field from the EventLog table. |
| Count of CaseId | Numerical | Use the CaseId from the EventLog table and choose Count (distinct) from the drop-down-menu. |
Formatting:
In the formatting pane ![]() you can personalize and customize the PAFnow Lead Time Calculator. Following we show and explain you the different possibilities for customization:
you can personalize and customize the PAFnow Lead Time Calculator. Following we show and explain you the different possibilities for customization:
Time selector
| Name | Description |
|---|---|
| Color | Changes the color of the selected box on the left and on the right. |
| Text Color | Changes the color of the icons on the left and on the right. |
| Text Size | Changes the size of the icons on the left and on the right. |
Activity selector
| Name | Description |
|---|---|
| Color | Changes the color of the activity selection list on the left and on the right. |
| Text Color | Changes the text color of activities on the activity selection list on the left and on the right. |
| Text Size | Changes the text size of activities on the activity selection list on the left and on the right (in points). |
| Hover Color | Changes the color when hovering over the activities. |
| Selection Color | Changes the color in which the activity is colored when it is selected. |
| Checkmark Color | Changes the color of the check mark when an activity is selected in the selection bar. |
Time box
| Name | Description |
|---|---|
| Color | Changes the color of the calculated time. |
| Text Color | Changes the text color of the calculated time. |
| Text Size | Changes the text size of the calculated time (in points pt). |
| Hide Zeros | If activated, any 0 between the time units is omitted. |
| Duration Units | Allows four options to display the format: All: Each unit is displayed. 3: Only the first three units are displayed. 2: Only the first two units are displayed. 1: Only the first unit is displayed. |
| Least significant | If activated, the value is displayed in the smallest unit (usually seconds). |
Y-Axis
| Name | Description |
|---|---|
| On/Off | Turns the Y-axis label on and off. |
| Color | Changes the color of the axis label. |
| Text Size | Changes the text size of the axis label. |
| Show Title | Shows and hides the title. |
| Title | Here you can manually enter a title. |
| Title Color | Here you can set the text color of the title. |
| Title Text Size | Here you can set the font size of the title. |
| Gridlines | Here you can set whether reference lines should be shown or hidden. |
| Gridline Color | Determines the color of the reference lines. |
| Orientation | Set the orientation of the Y-axis. You can choose between left and right. |
X-Axis
| Name | Description |
|---|---|
| On/Off | Turns the X-axis on and off. |
| Color | Changes the color of the axis label. |
| Text Size | Changes the text size of the axis label. |
| Show Title | Shows and hides the title. |
| Title | You can manually enter a title. |
| Title Color | Here you can set the text color of the title. |
| Title Text Size | Changes the size of the title. |
| Bars Color | Changes the color of the bars. |
| Bars Hover Color | Changes the color of the bars on hover. |