PAFnow Process Explorer
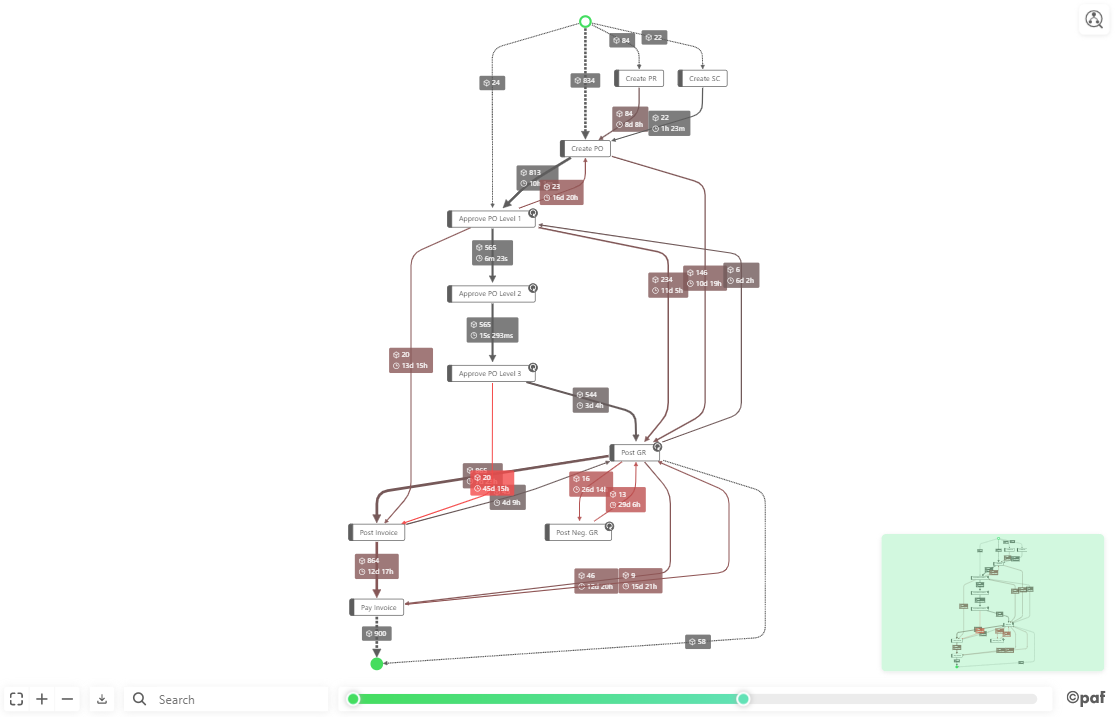
The PAFnow Process Explorer visualizes your business process automatically in a process flow. It is the central element of the PAFnow Report. You can find it on all report pages where it will show you different aspects of your process flow. This helps you to evaluate and understand your as-is process performance including all paths and branches. The PAFnow Process Explorer also enables you to filter for individual process steps or paths to gain deeper insights.
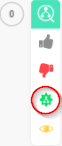
This is the icon of the PAFnow Process Explorer in the visualizations pane:
![]()
How to get started
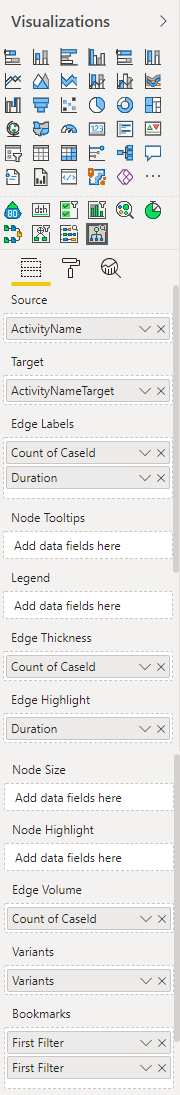
The PAFnow Process Explorer needs two pieces of information to work properly: Source and Target. It also has extra features (e.g. slider) that require additional information and completely optional fields which you can add if you want to display more information in your process flow. Before you can use the Process Explorer you need to drag the required fields into their respective buckets.
Example
Source: The Process Explorer needs this information to recognize the initial event of a path. (In the example, we dragged the ActivityName column from the EventLog table into the Source area in the visualizations pane.)
Target: The PAFnow Process Explorer needs this information to recognize subsequent events of a path. (In the example, we dragged the ActivityNameTarget column from the EventLog table into the Target-area in the visualizations pane.)
Edge Volume: Drag and drop the CaseId (as Count of CaseId) from the EventLog table to enable the slider of the visual.
Variants: Drag and drop the measure Variants from the EventLog table to enable filtering and the slider of the visual.
To add further information to your process flow, see the table of Optional Fields.
How to use
Once you have selected the required fields (and any optional fields you want to add) for the PAFnow Process Explorer, you can start to use its different features to analyze your process.
Conformance Check
The Conformance check measures how well a model compares to the event log in which the executed events are recorded. Our Process Explorer enables you to define your model and compare it to the executed processes.
How to define a conformance reference model
To start or stop the Conformance Mode, click the button at the top right of the visual  .
.
When Conformance Mode is started and no reference model is set yet, there is an Auto Conform Button that helps you to automatically calculate a reference model based on the variants that cover 80 percent of the cases. Otherwise the model you have saved in the visual is used.
You can move the slider or set filters to mark your individual variants as conform  or non-conform
  .
.
You can also add individual edges and nodes to your selection and mark them as conform or non-conform using the conformance menu or right-click on the selected process steps.
Set reference model with conformance menu
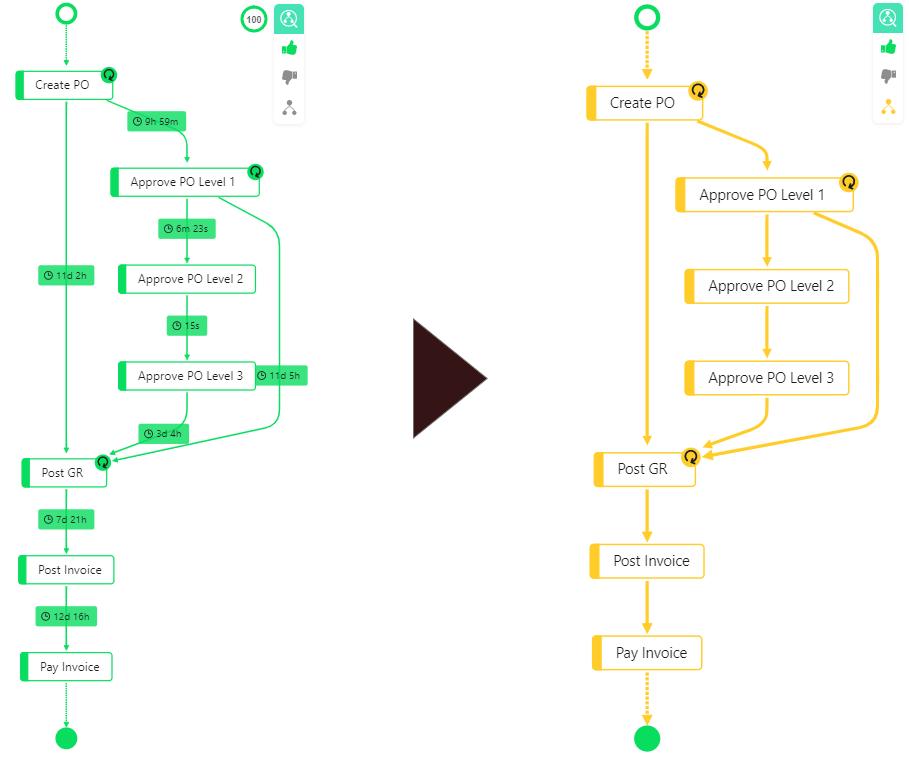
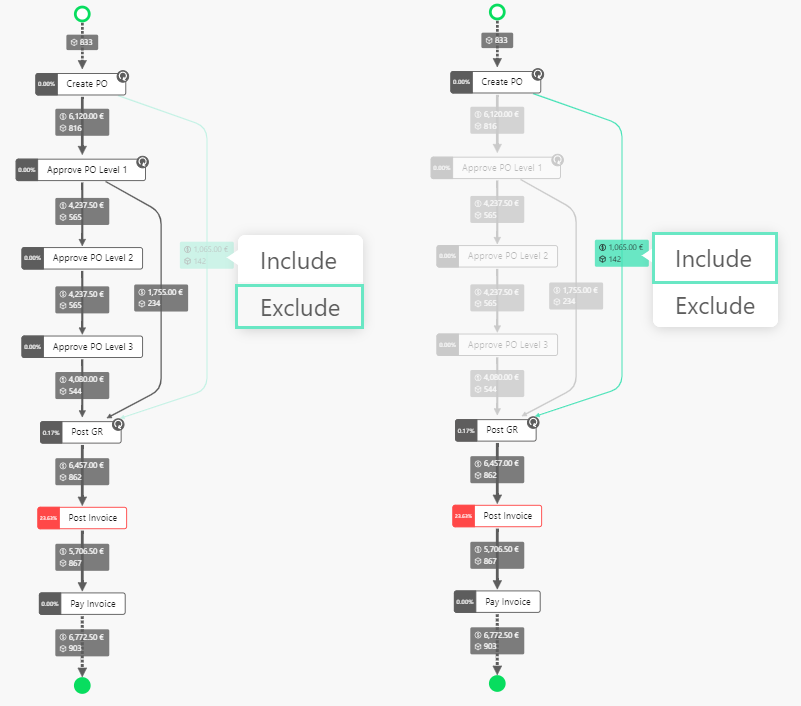
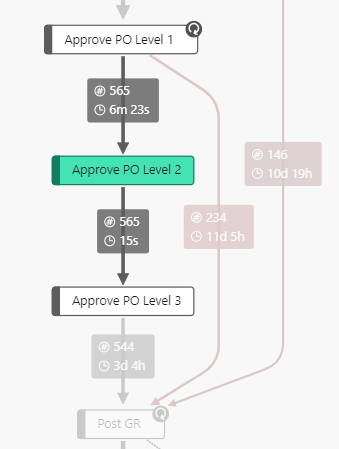
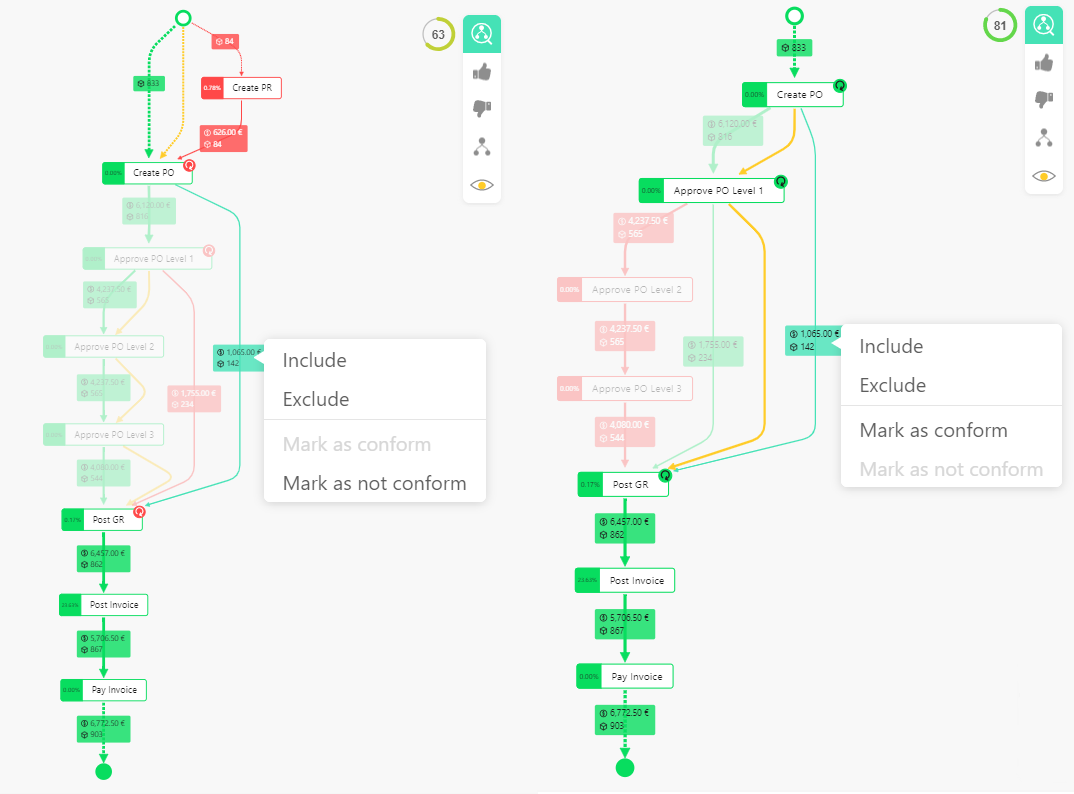 The process step between
 Create PO and Post GR on the right, currently marked as conform and therefore highlighted in green can be excluded from model and marked as non-conform. The image on the right shows the resulting non-conform process sequence that could be marked as conform via right-click again.
How to interact with the reference model
To see your current reference model, you must press the  -button in the conformance menu.
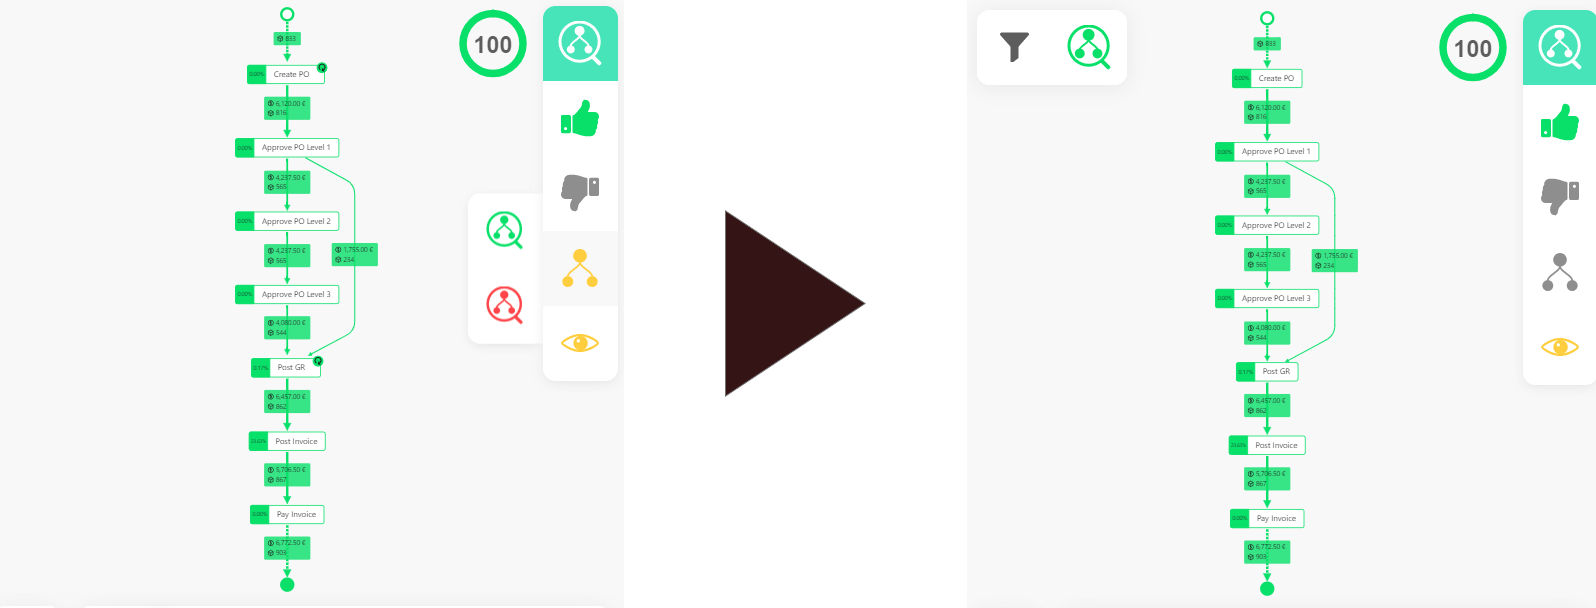
Show Reference Model
The example shows what the process variants assigned to the model would look like. The reference model on the right side is saved without labels and can be restored at any time.
If you move the mouse over , a sub-menu opens where you can filter your data according to conform or non-conform processes.
Set filter for conforming
For example, if you want to know how effective your model is, you can simply filter the data by clicking the filter conform-button  . After applying the filter it will appear in the filter pane of the context-menu. This way it is possible to remove the individual filter without removing any other set filter, see.
The same filter would be possible for the non-conform processes using the non-conform-filter  .
.
After defining your model, you can evaluate different states of your process flows. The results are generated by calculating the so-called Fitness, which indicates the cost relationship between your reference model and a specific case. Our calculated Fitness is number between 0 and 1 (displayed as absolute value). The lower the score, the more different the specific case and the reference model are. We use the following formula to calculate the Fitness :
In accordance to this formula, we calculate the cost that is required to obtain the target model (CostOfCase) for a specific case (c) and divide it by the cost that this specific case would have in worst case (CostOfCaseInWorstCase). The worst case as such would be if no process step of the case matches the reference model. A case not matching any of the process steps shown by the reference model would have a Fitness of 0. If the case matches the target model exactly, the CostOfCase would be 0 and therefore the Fitness would be 1.
A fitness of 100% indicate that only conform steps are used in the selected process; as such measures of less than 100% include process steps marked as non-conform either by you, e.g. via right-click on the process step, or the conform process reference model.
The result donut in the upper right corner of the Process Explorer  shows the average Fitness, which is the sum of the individual Fitness of a single case divided by the total number of cases reviewed in the selection.
If you hover the mouse over the result donut, you will get more information about the result in form of a tooltip.
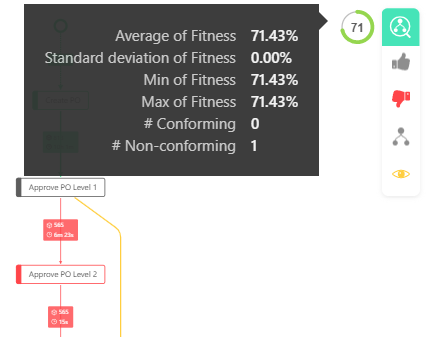
Conformance Tooltip Details
| Name | Description | |
|---|---|---|
| Average of Fitness | Indicates the average of Fitness, this value is also displayed in the result donut. | |
| Standard deviation of Fitness | Specifies how strongly the Fitness is distributed between the cases. | |
| Min of Fitness | Shows the lowest Fitness of all current cases. | |
| Max of Fitness | Shows the highest Fitness of all current cases. | |
| # Conforming | Shows the number of processes that are Conform. | |
| # Non-Conforming | Shows the number of processes that are Non-Conform. |
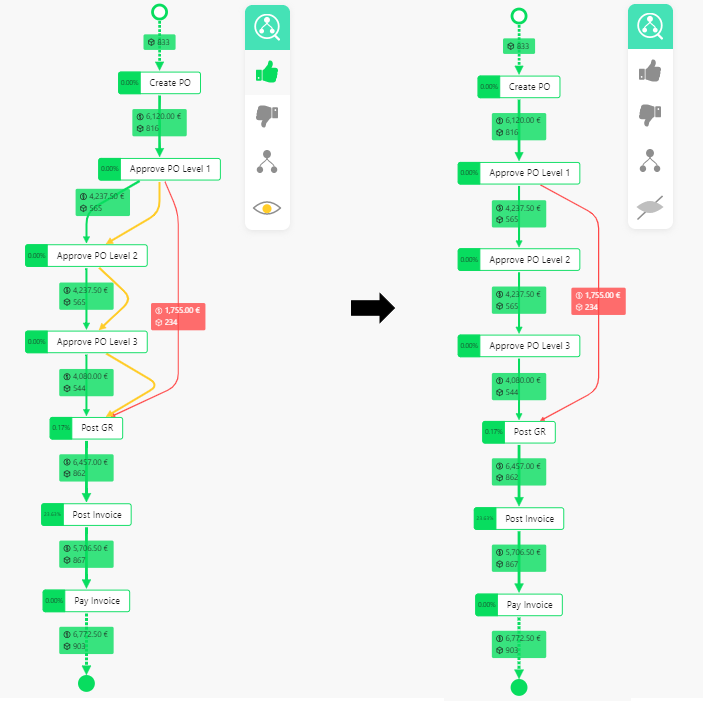
You can display  or hide
  the skipped model movements using the last button in the conformance menu .
Show/Hide Skipped Model Movements
In this example, there is a process variant that has Approve PO Level 2 and Approve PO Level 3 skipped, so that the skipped movements are displayed on the left. The skipped movements are not displayed on the right side where the movements are disabled through the conformance menu.
Multi-Layout (Legend)
The multi-layout is used to visualize grouped processes that are set via the legend field (see). There are three different ways to create a grouped process flow: Unique-Highlight, All-In-One and Side-By-Side.
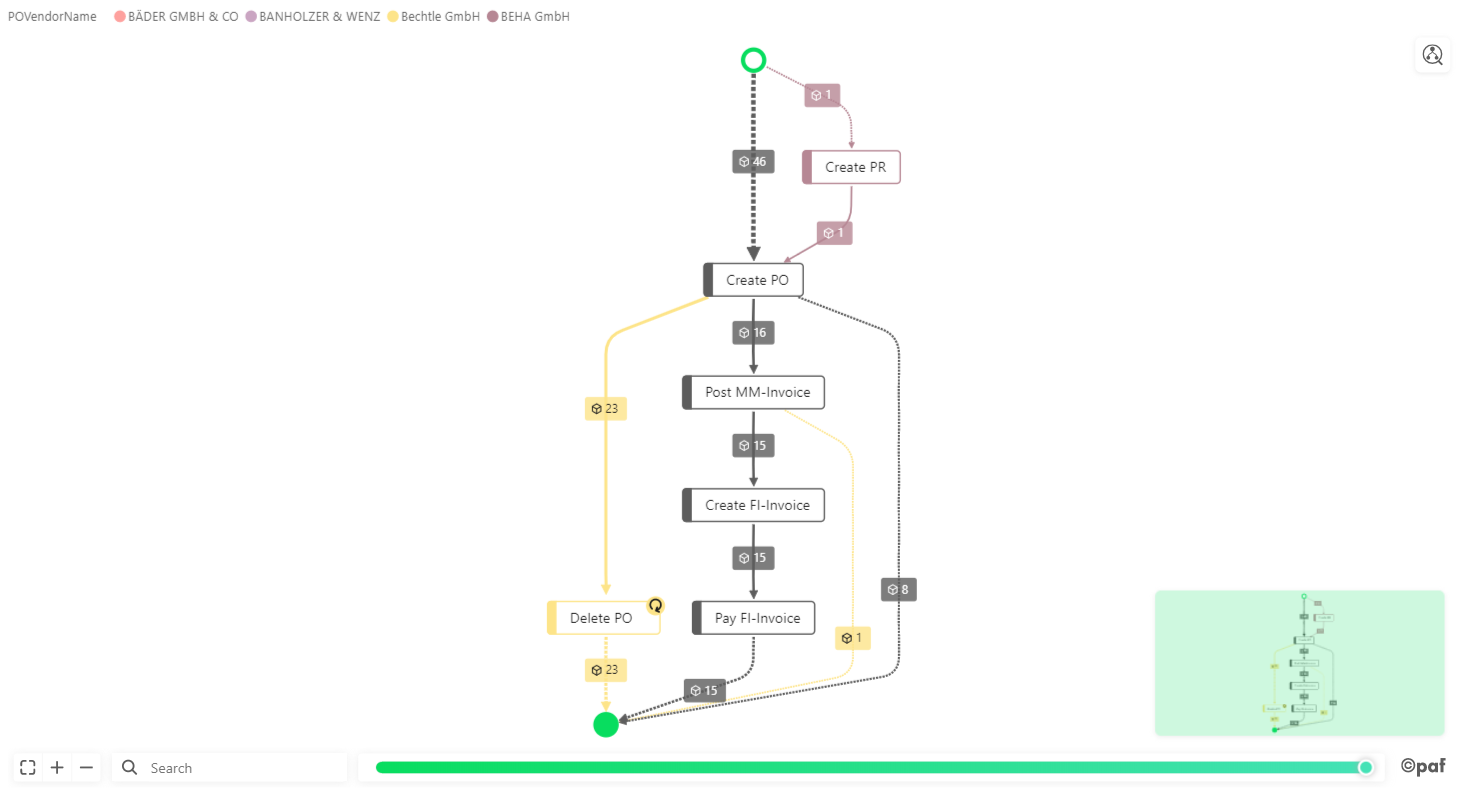
Unique-Highlight
The unique path between two processes (for example, the path of an unique vendor) is highlighted.
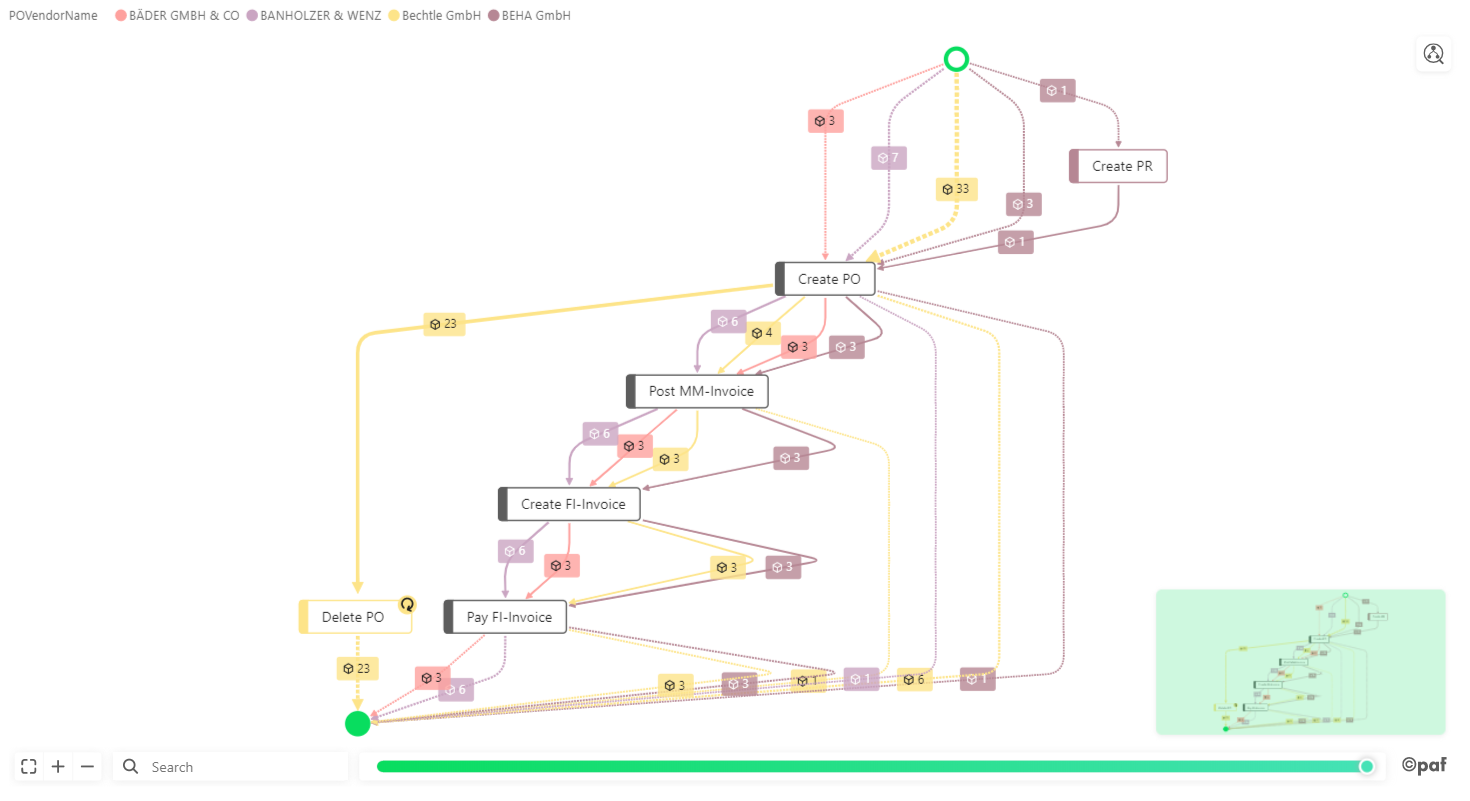
All-In-One
The process flow is visualized with multiple paths between processes (e.g. each path correspond to each vendor).
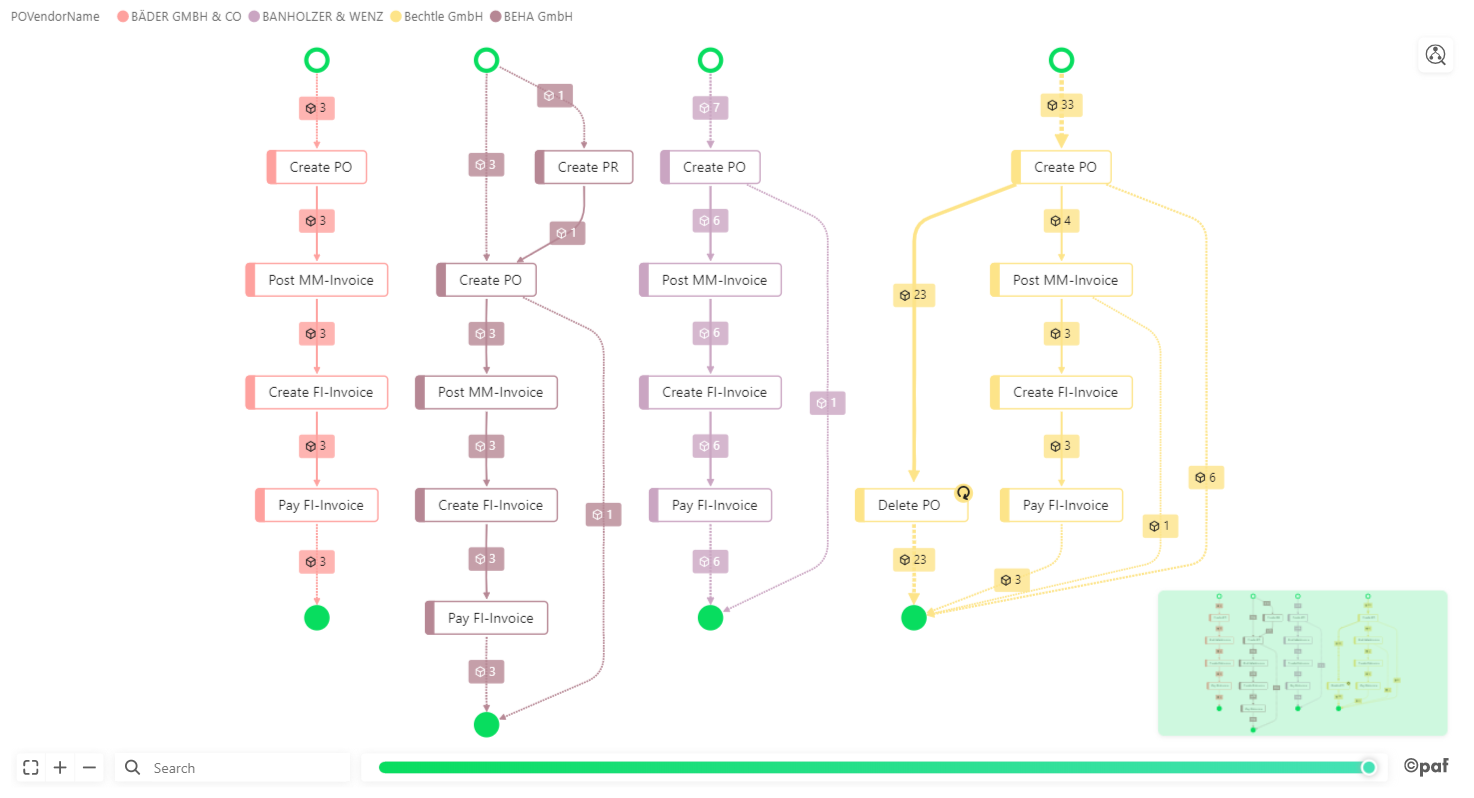
Side-By-Side
Multiple process flows are visualized next to each other by legend (e.g. each process flow corresponding to a single vendor).
Filter
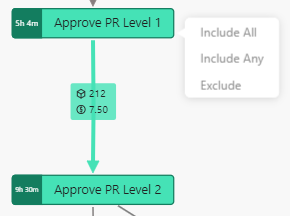
The Process Explorer provides many filter options. You can select one or more (using CTRL) process steps or paths in the process flow and apply filters via right-click.
| Filter option | Description |
|---|---|
| Include | Display all process variants containing the selected nodes/paths. |
| All | e.g. Include All means only those process variants containing all selected nodes/paths are displayed. |
| Any | e.g. Include Any means all process variants containing at least one of the selected nodes/paths are displayed. |
| Exclude | Display all process variants not containing the selected nodes/paths. |
Filter Pane
The filter pane shows all set filters. As you can see, you can set multiple filters at the same time. 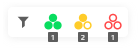
There are three types of filters:
 Include All filters
 Include Any filters
 Exclude filters
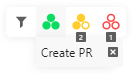
You can delete a single filter by clicking on the  -button when hovering over a set filter:
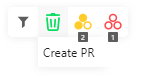
To remove all filters of one type, hover over the type you want to clear and click the trash-can-symbol:
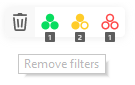
To remove all set filters, hover over the filter-icon itself and click the trash-can-symbol:
Filter Preview
If filter preview is activated under Advanced, the desired filter is highlighted while moving with the mouse over the filter option in the context menu.
Example
Slider

In order to use the slider you have to fill in the Edge Volume bucket and Variants bucket (see Required Fields).
The slider in the Process Explorer can be used to increase or decrease the complexity of the process picture. When you start analyzing you process, the slid control buttons are set to the very left, this way only showing a graph with minimal complexity. You see the most common Happy path of your process. If you want to increase the complexity of your graph, just move the right slid control button to the right. Hereby, you add more paths to the picture including nodes and edges of the Not Happy path. By sliding completely to the right you can see the complete picture of the process for all your cases and variants.
In case you are only interested in the less common Not Happy paths of your process, you can also keep the right end of you slider where it is and move the left slide control button to the right side. To evaluate a window of processes between the two extremes, you can shift your set slider and move the bar in both directions.
Minimap
The minimap indicates the zoom state and viewing area of the whole process flow.
Tooltip
When you hover with the mouse-pointer over a path or process step, you will see the so-called tooltip. It displays your additional numerical and temporal information about the selected element. These have been specified under Edge Labels and Node Attributes.
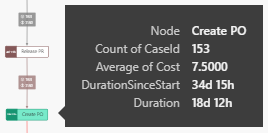
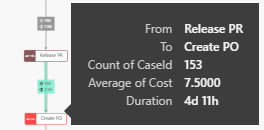
The Process Explorer supports the Report Tooltip functionality of Microsoft Power BI, we refer to Microsoft Power BI - Report Tooltip for detailed information how to setup your tooltips. Default tooltips for the path will be replaced with your defined Report Tooltip.
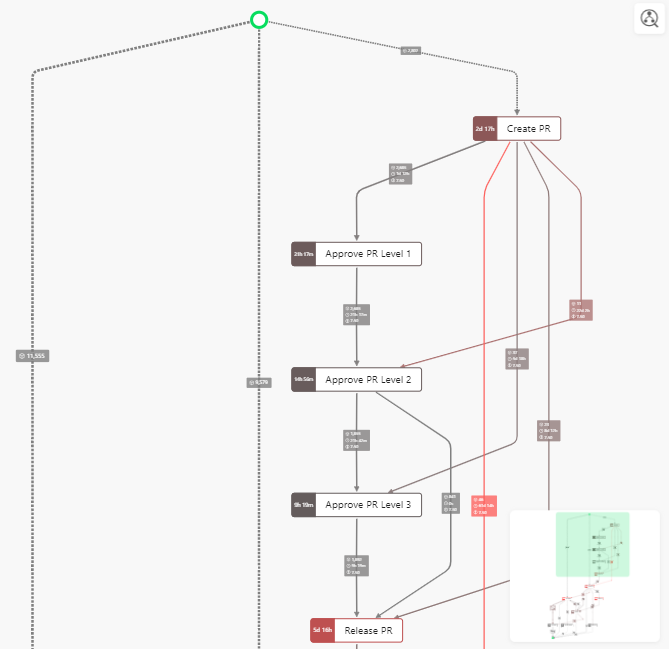
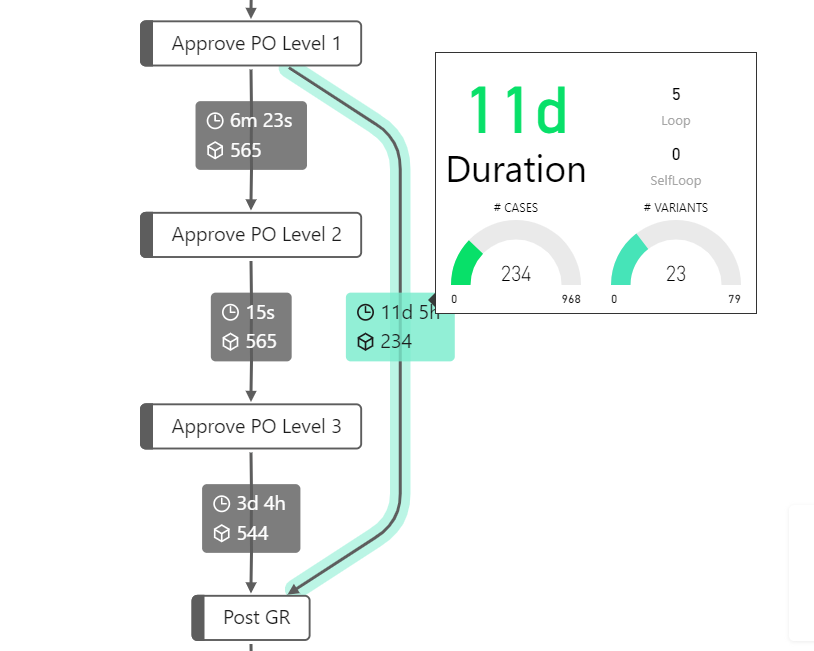
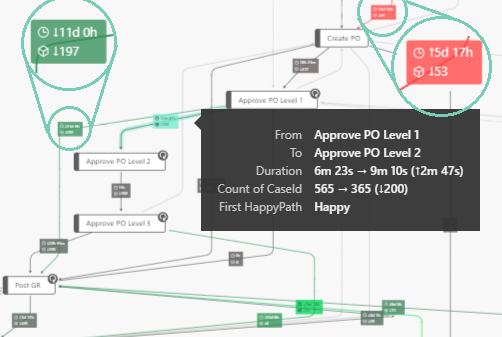
Report Tooltip with some path related information
As an example of a defined tooltip the PAFnow Duration Card with a summarized duration-text of the path, was added to the process path. Uniformly every other visual can be added to the tooltip.
Search Function
In the search bar you can search for individual process steps. The process steps containing your keyword are highlighted. By pressing Enter at the end of your search, the Process Explorer will zoom in on the found nodes.
Zoom Behavior
You can zoom in and out of the process flow by turning the mouse wheel up and down while the mouse is over the viewport. The process flow can also be dragged by holding the left mouse button.
Navigation and zooming can also be performed with the keyboard, using the arrow keys (↑↓→←) to navigate and the plus/minus (+ -) key to zoom.
You can also zoom-in using the button in the lower left of the visual area with  and zoom-out using
  . By pressing
  the complete process flow is displayed.
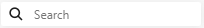
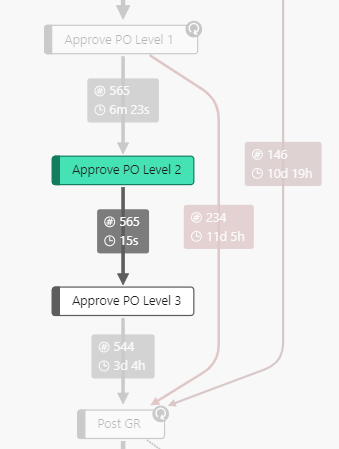
Variant Indicator
| Only successors | Only predecessors | Sucessors and predecessors |
|---|---|---|
| Shows the successor of the process node or edge clicked. | Shows the predecessor of the process node or edge clicked. | Shows the successor and the predecessor of the process node or edge clicked. |
 |  |  |
Highlight
You can set a highlight for nodes and/or edges to color them depending on the values in the bucket. You can also change to different scales when using the formatting tab for different color-mappings:
There you have 4 choices:
| Name | Description |
|---|---|
| Linear | Creates a linear based scale for the highlight values |
| Sqrt | Creates a square-root based scale for the highlight values |
| Log | Creates a logarithmic based scale for the highlight values |
| Outlier | Creates a linear based scale for outliers, which is similar to a box plot. |
Outlier
When selecting the outlier scale function, you can also set the outlier factor. It is used to calculate the 25th (Q25) and 75th quantile (Q75) and detects outliers based on the inner quartile range (IQR). That is:
Values outside 1.5 (Outlier factor) IQRs of both the Q25 and the Q75 are defined to be outliers The outlier factor can be controlled via settings
Deviation Highlight
Highlights and shows the absolute differences based on the selected data points compared to the unselected ones (similar to the Root-Cause-Analyzer). It can be activated in the formatting tab under Advanced/Deviation Highlight.
BPMN Export
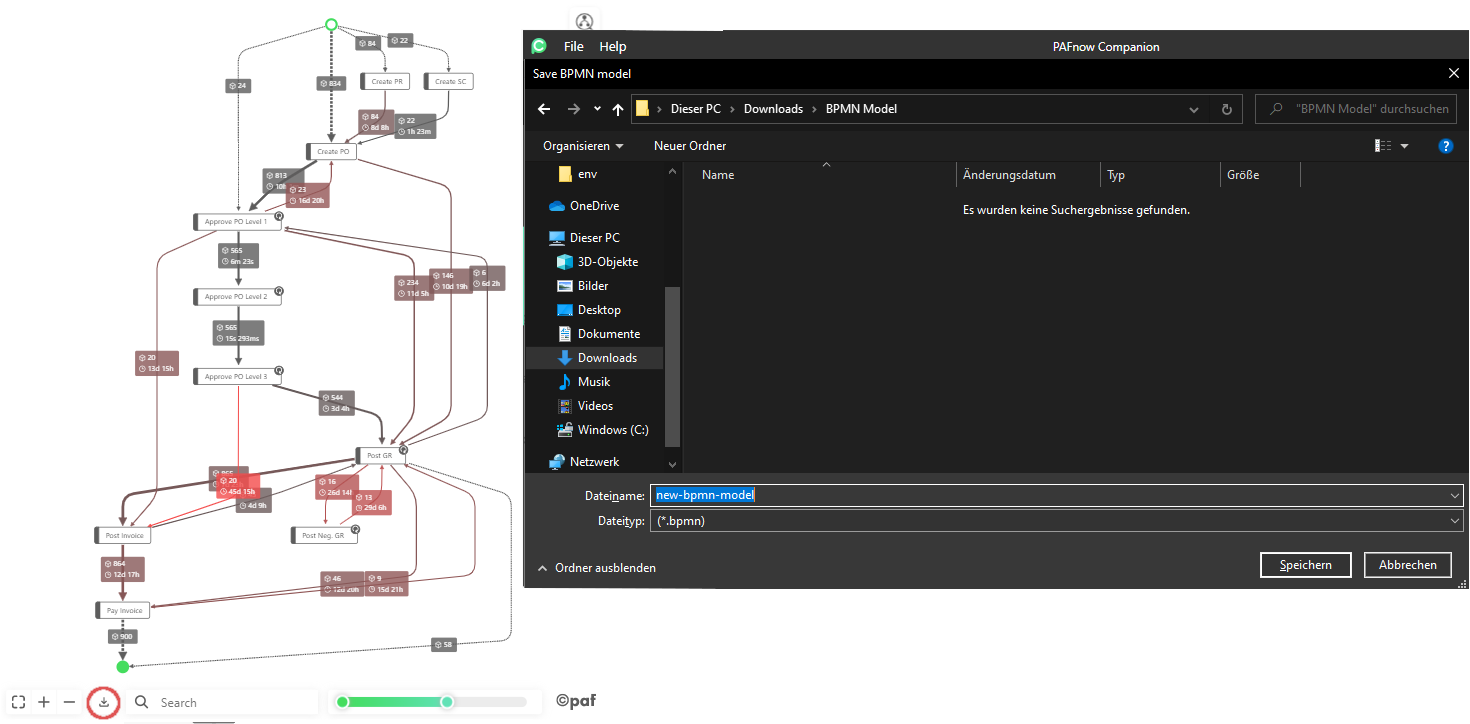
To export your current graph as a BPMN model, just press the Export to BPMN button in the toolbar. A saving dialog will open up in the PAFnow Companion and you can choose where to save the BPMN model.
Info
You need to run the PAFnow Companion 1.3.0 or later, otherwise the BPMN export button will not be visible.
Specification
Required Fields:
In order to use the Process Explorer, you have to drag the required fields into the respective buckets.
| Name | Type | Description |
|---|---|---|
| Source | Categorical | Use the ActivityName field from the EventLog table. |
| Target | Categorical | Use the ActivityNameTarget field from the EventLog table. |
| Edge Volume | Numerical | Use the Volume measure or the CaseId field (as Count of CaseId) field from the EventLog table |
| Variants | - | Use the Variants measure from the EventLog table. |
Optional Fields
To use the additional functionality of the Process Explorer, use the following optional field
| Name | Type | Description |
|---|---|---|
| Edge Labels | Any | Here you can enter values that you want to be displayed as information on the paths in your process flow. (e.g CaseId from the EventLog table). The Number of Edge Labels selected in the formatting pane defines the number of the attributes (listed at the top of the Edge Labels bucket) that will be displayed as information on the process path labels. Additionally, all the attributes will be shown as a tooltip. |
| Node Tooltips | Any | This field is used to display values on the node as a tooltip. |
| Legend | Categorical | Here you can enter a categoric value to split the graph into different categories. See example above |
| Edge Thickness | Numerical | Select an attribute to determine the path width. For example, if you want the paths to differentiate by the number of cases, drag the CaseId column from the Graph table into the Edge Thickness panel and select Count from the drop-down-menu. |
| Edge Highlight | Numerical | Select an attribute to be used to determine the path color. For example, if you want to highlight the paths that have a long average lead time, drag Duration from the EventLog table to the Edge Highlight bucket and choose Average in the drop-down-menu. |
| Node Size | Numerical | Select an attribute to determine the node size. For example, if you put the CaseId column from the EventLog table into the Node Size bucket and choose Count in the drop-down-menu, the nodes are scaled depending on the number of cases that went through individual nodes. |
| Node Highlight | Numerical | Select an attribute to determine the nodes marked by a color similar to the Edge Highlight. |
| Bookmarks | - | This field is only used to support the bookmark feature. To enable this feature, drag and drop each Filter columns from the FilterAnd and FilterOr table in the Bookmarks bucket and choose First. |
Formatting
In the formatting tab ![]() you can personalize and customize the PAFnow Process Explorer according to your preferences. We show and explain the different possibilities below.
you can personalize and customize the PAFnow Process Explorer according to your preferences. We show and explain the different possibilities below.
Themes
| Name | Description |
|---|---|
| Primary Color | The primary color used in the color theme |
| Secondary Color | The secondary color used in the color theme |
Nodes
| Name | Description |
|---|---|
| Font size | The font size for node labels |
| Color | The color of all nodes |
| Low values | Color for the low values when using the highlight bucket |
| High values | Color for the high values when using the highlight bucket |
| Highlight scale | Scales the highlight for different color-mappings |
| Outlier factor | When using the outlier highlight scale, you can control the factor to set outliers |
| Invert Highlight | Invert the highlight colors |
| Invert Size | Invert the node size scale when node size is set |
| Border Color | Node border color |
| Border Width | Node border width |
Edges
| Name | Description |
|---|---|
| Font Size | Font size for edge labels |
| Color | Default edge color |
| Low values | Color for the low values when using the highlight bucket |
| High values | Color for the high values when using the highlight bucket |
| Highlight scale | Scales the highlight for different color-mappings |
| Outlier factor | When using the outlier highlight scale, you can control the factor to set outliers |
| Invert Highlight | Invert the highlight colors |
| Invert Thickness | Invert the edge thickness scale when edge thickness is set |
| Min Thickness | The minimum value of the thickness of an edge |
| Max Thickness | The maximum value of the thickness of an edge |
| Number of Edge Labels | Number of edge labels shown in the graph |
| Relative Edge Label Size | Scale edge labels according to edge thickness |
| Duration Units | Select how many units are displayed |
| Hide Duration Zeros | Hides zero values of duration |
| Precision | Precision for the decimal rounding |
| Most Significant Unit | Durations will be shown with the most significant unit |
| Least Significant Duration | Displays the path description in the smallest unit. |
Conformance Check
| Name | Description |
|---|---|
| On - Off Toggle | Enable or disable the Conformance Check Mode. |
| Auto-mode Toggle (Deprecated) | Enable or disable the Auto Mode. Marks the process steps as conform that explain 80% or more of the cases. |
| Is conform Color | Changes the color for the conform edges. |
| Is not conform Color | Changes the color for the not conform edges. |
| Skipped Color | Changes the color for the not clearly marked edges. E.g. when you mark an edge in one variant as conform and in another variant as not conform. |
| Show Model Moves | Shows or hides the skipped model moves. |
Legend
| Name | Description |
|---|---|
| On - Off Toggle | Enables or disables the legend. |
| Position | Choose where the legend should be positioned. |
| Title | Enable or disable the title for the legend. |
| Legend Name | Type in a title for the legend. Default is the column name of the inserted field. |
| Color | Changes the text color for the legend. |
| Font Size | Changes the font size of the legend text. |
Data colors
| Name | Description |
|---|---|
| On - Off Toggle | Enables or disables the legend colors |
Layout
| Name | Description |
|---|---|
| Multi Graph Layout | Choose how the multi graph should look like: 1. Unique-Highlight 2. All-in-One 3. Side-by-Side |
| Direction | Changes the flow direction of the process flow. |
| Alignment | Changes the alignment of process steps in the process flow. |
| Rank Separation | Changes the vertical distance between process steps depending on the flow direction. |
| Edge Separation | Changes the distance between paths. |
| Node Separation | Changes the horizontal distance between process steps depending on the flow direction. |
Advanced
| Name | Description |
|---|---|
| Filter preview | Enables or disables the preview of the resulting graph on hover in context menu. |
| Variant indicator | Enables or disables the highlighting of variants on selection. |
| Enable minimap | Enables or disables the minimap. |
| Highlight updates | Enables or disables the animation of new edges or removed edges. |
| Deviation Highlight | Enables or disables the Deviation Highlight so that you can compare the filtered state with the Power BI highlight |
Cache
This cache is used to store complex methods that take time, such as the layout, to speed up future updates.
| Name | Description |
|---|---|
| Size | Size requires a number that is translated into megabytes(MB), a zero 0 resets the cache and disables it. |
Slider
| Name | Description |
|---|---|
| Show Tooltips | Enables and disables tooltips for the slider. |
Search
| Name | Description |
|---|---|
| Search threshold | Changes the search accuracy. |