Discovery
When you open up your PAFnow Standard Report, you land on the PAFnow Discovery Page. This report page is the starting point and the center of your analysis. The visuals and report elements on the Discovery Page are tools that help you to understand and analyze your business processes and to receive complete transparency about them.
Agenda
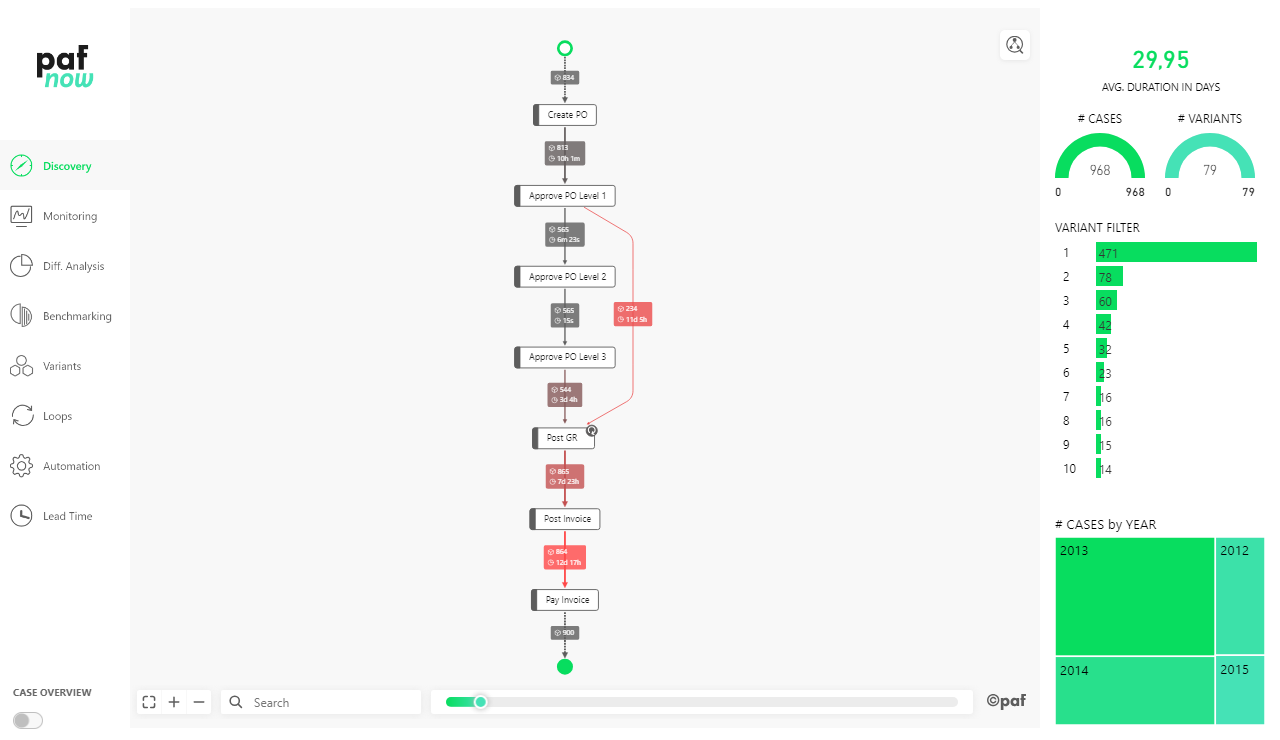
The Discovery Page consists of several components seen above:
- The menu on the left helps you to navigate through the most important pages of the PAFnow Report. The page you’re currently working on is highlighted in green.
- A switch-button in the bottom left corner enables or disables the Case Overview Table.
- In the middle of the page you can see the PAFnow Process Explorer. It is the most important Custom Visual, the core of Process Mining.
- On the right side, you can see the navigation bar which helps you to explore your process picture in detail. It contains several tiles with key information about your process and can be customized to your needs.
A bar either at the bottom or the left side of the window (this depends on whether you are in edit or in view mode), provides an overview of all Report Pages and can be used to jump from one page to another. 
PAFnow Process Explorer
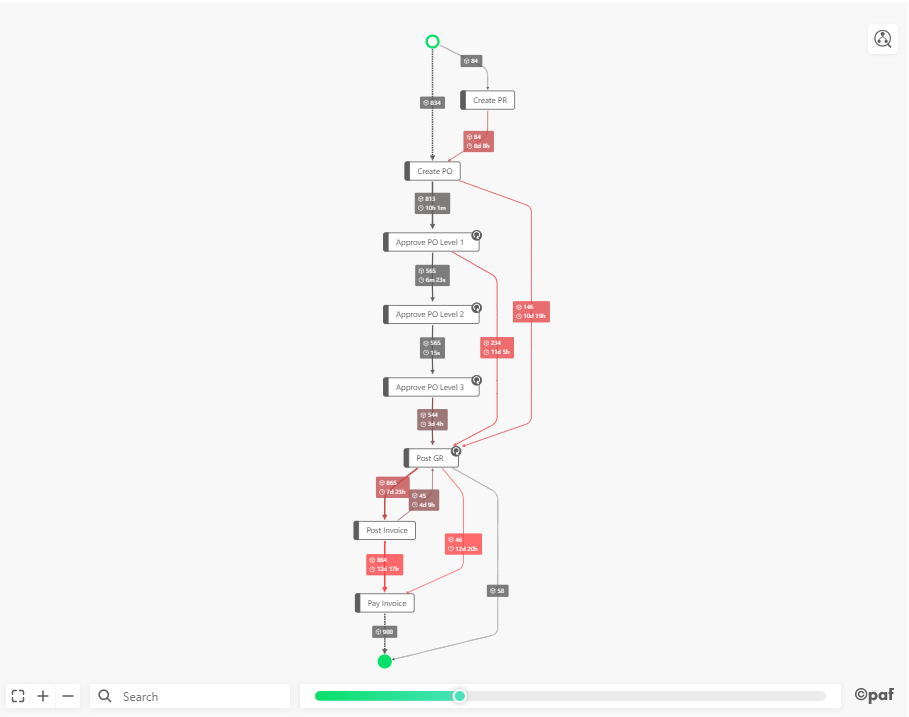
With the PAFnow Process Explorer, your business process is visualized automatically in a process flow. The Process Explorer is the most important PAFnow Custom Visual. You can find it on almost every report page. On the Discovery Page, the Process Explorer provides an overview on your process as a whole, including all path and branches.
Example
This example process shows a common purchase to pay process flow:
Edges and Edge Labels
Edges, meaning the paths of the process flow, and edge labels provide two essential numbers for each of your process steps: duration and the number of cases
- The paths highlighted in red indicate process steps with longer durations in relation to the general duration times of the process.
- The width of the path is wider when a high number of cases flows through that path (e.g. Post GR to Post Invoice).
- In addition to the average duration between activities, the edge labels also show how many cases went over this particular edge.
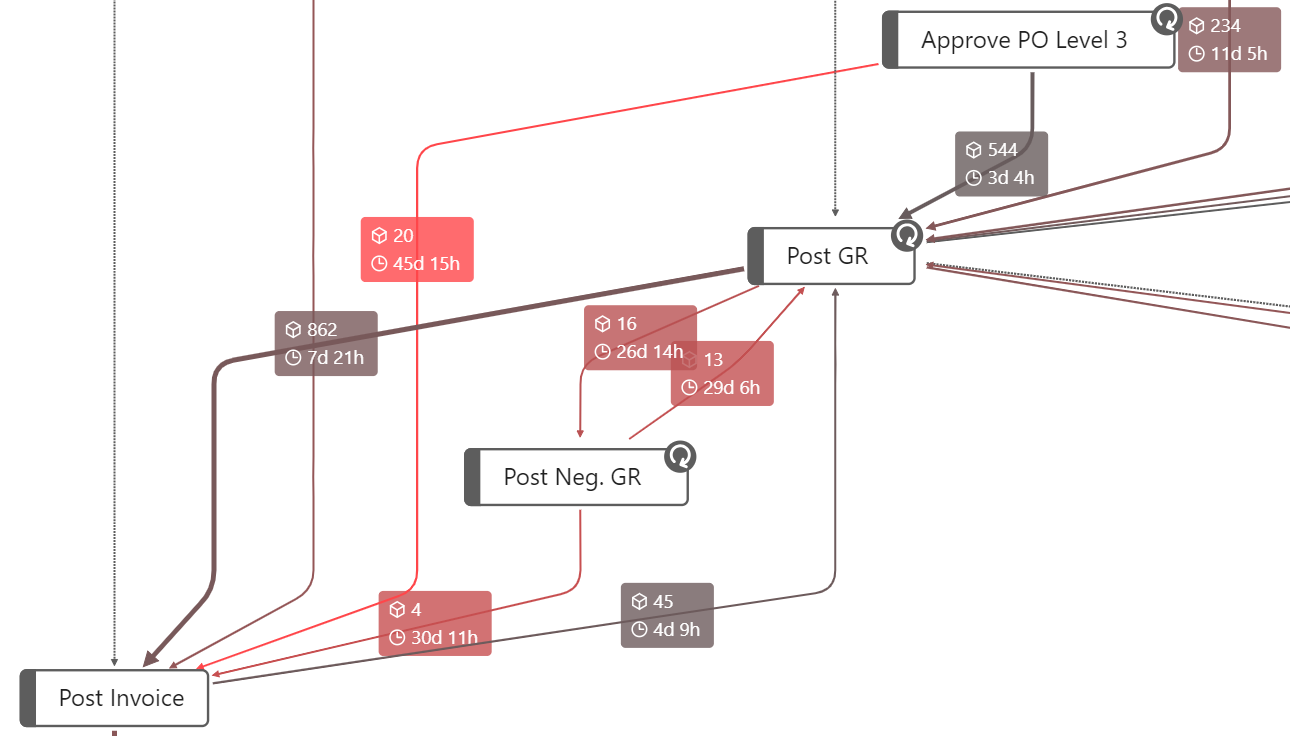
For example, the average duration from the process step Approve PO Level 3 to the process step Post Invoice is 45 days and 15 hours. So, it is relatively long compared to the durations between other process steps as you can see in the picture above. It also shows you that this duration time applies to 20 cases. This gives you a first hint at bottlenecks in your process.
Filter Options and Functions
In addition to information functions (such as the Edge Labels), the Process Explorer offers you the possibility to filter for individual process steps or paths to get deeper insights. You can select (via CTRL) one or more process steps or paths in the process flow and choose the filter option via right-click.
These and many more features are explained under PAFnow Process Explorer in the Custom Visuals section of the documentation. The section Functions in the Process Explorer documentation explains the possibilities you have to filter and navigate in your process graph.
Navigation Bar
Through the navigation bar on the right side of the Discovery Page, you can further control the process flow to receive more targeted evaluations.
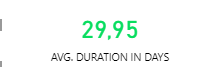
Average Duration
The AVG. DURATION IN DAYS is visualized with a card visual. In the example, the AVG: DURATION IN DAYS of the entire process is displayed:
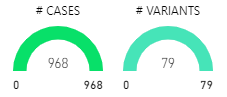
Cases and Variants
The gauge visualizations show you the absolute number of currently filtered and displayed cases and variants:
Tip
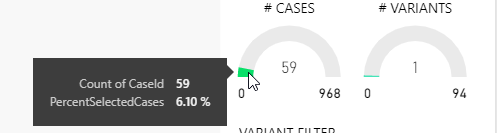
If you want to see the percentage share of your cases or variants instead of the absolute number, then you can display the share in the tooltip by hovering the mouse pointer over the green semi-circle.
Variant Filter
The PAFnow Variant Filter gives you the option to filter for (one or more) individual variants.
Each variant was given a unique ID during data processing (the number in front of the green bars) to better identify it for the analysis. The length of the bars depends on the number of cases that flow through each variant. The exact number of cases is also displayed inside or next to the bar.
Example
In the example the top variant with the ID 1 is the most frequent and covers 471 cases. If you select one or more variant(s) with the Variant Filter the entire Discovery Page is filtered based on your selection. 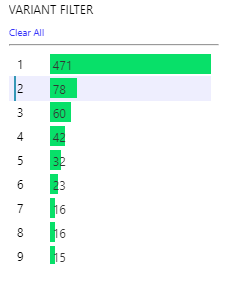
Treemap: # CASES by YEAR
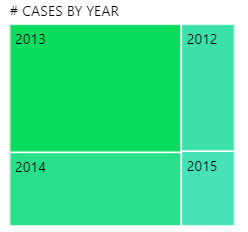
With the Treemap visual you can filter your Discovery Page by several attributes. In the example, the Treemap shows different years, so the filter can be set for one or more specific year(s).
Tip
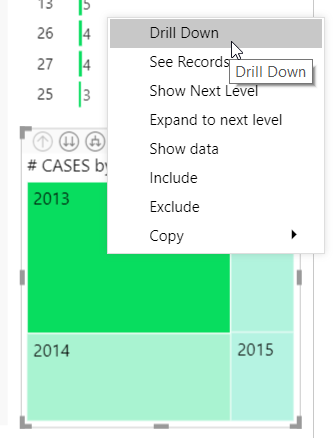
With the drilldown functionality, you can drilldown to the next hierarchy level. Each level shows a different attribute relevant to your process. In the example, the drilldown leads you to the lead time in days.
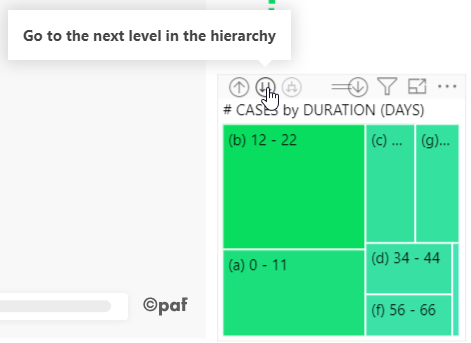
When you click on the double arrows-button you jump to the next hierarchy level of the Treemap. You can then set filters or drilldown further to your desired level.
Case Overview Table
The Case Overview Table is hidden by default in the Discovery Page.
It can be displayed on the bottom of the report page by clicking on the CASE OVERVIEW-button (and simultaneously pressing CTRL when using the Power BI desktop application):

The Case Overview Table provides an important overview on the connection of selected attributes and documents. For example, if the Purchase Order Number, Invoice Number, Vendor and Plant are selected as fields, this information is displayed on the single document level (case level). This allows you to display all important information about a single business transaction.
While you are working on the Discovery Page, the Case Overview Table is constantly updated and filtered. If you select a column header, the entire Case Overview Table is sorted by this column:
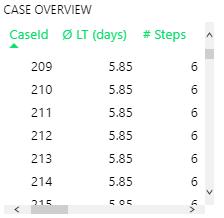
In this example the Case Overview Table is sorted by the CaseId-column.
Column Description:
| Column Name | Meaning |
|---|---|
| CaseId | Unique identification number for each business transaction. |
| Ø LT (days) | Average lead time (LT) for the entire process per case. |
| # Steps | Number of process steps the case has gone through. |
| # Distinct Process Steps | Number of unique process steps the case has gone through. |
| StartTime | Start time of cases. |
| EndTime | End time of cases. |